
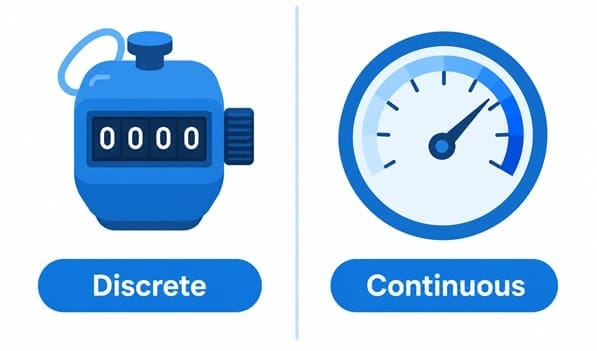
Quantitative data is information expressed as a number, measured or counted, that supports real arithmetic. You can average it, add it, and run statistical tests on it. This is what separates it from qualitative data, which describes categories or labels instead of amounts. Quantitative data splits into two types: discrete and continuous. Discrete data counts in whole units, like the number of defects on a shift. Continuous data measures along a scale that can take any value, like weight or cycle time.
Here’s the insight most explanations skip entirely: continuous data carries more statistical information per observation than discrete data does, which means a Six Sigma team can often reach the same confidence level with a much smaller sample size. That single fact changes how experienced practitioners design their data collection plans.
Quick-Reference Table: Quantitative Data at a Glance
| Dimension | Discrete Data | Continuous Data |
| Takes what values | Whole numbers, counted | Any value within a range, measured |
| Example | Number of defects per batch | Cycle time in minutes |
| Information per observation | Lower | Higher |
| Typical sample size needed | Larger | Smaller |
| Common control chart type | Attribute chart (p, np, c, u) | Variable chart (X-bar, R) |
Table of contents
- Quick-Reference Table: Quantitative Data at a Glance
- Key Takeaways
- What is Quantitative Data?
- Types of Quantitative Data: Discrete and Continuous
- Not Every Number Is Quantitative Data
- How Quantitative Data Connects to Interval and Ratio Scales
- Statistical Tools That Work With Quantitative Data
- How Quantitative Data Fits Into a Six Sigma Project
Key Takeaways
- Quantitative data is numeric and supports real math. You can average it, calculate a standard deviation, and run tests like a t-test or ANOVA on it.
- Discrete and continuous are the two types of quantitative data. Discrete data counts whole units. Continuous data measures along a scale.
- Continuous data holds more information per data point than discrete data. This isn’t a minor technical footnote. It directly affects how much data you need to collect.
- A smaller sample of continuous data can match the statistical power of a much larger sample of discrete data. This is one of the strongest practical arguments for measuring instead of just counting, whenever possible.
- Not every number is quantitative data. A zip code, an ID number, or a coded category looks numeric but behaves like qualitative data, since it carries no real quantity.
- Choosing the wrong data type early in a project misleads every analysis that follows. The classification decision happens before any statistical tool gets applied, not after.
What is Quantitative Data?
Quantitative data is any information expressed as a number that represents a real quantity, something you measured or counted, not something you simply labeled. Height, weight, temperature, cycle time, defect count, revenue. All of these are quantitative, because the number itself carries mathematical meaning. You can add two measurements together and the result means something real.
This is the exact test that separates quantitative data from qualitative data. Qualitative data describes a category or trait, like eye color or department name. You can count how often each category occurs, but you can’t meaningfully average “blue” and “green.” Quantitative data passes that test. Qualitative data doesn’t.

Public, Onsite, Virtual, and Online Six Sigma Certification Training!
- We are accredited by the IASSC.
- Live Public Training at 52 Sites.
- Live Virtual Training.
- Onsite Training (at your organization).
- Interactive Online (self-paced) training,
Types of Quantitative Data: Discrete and Continuous
Quantitative data splits into exactly two categories, and the difference between them matters more than most explanations suggest.
Discrete data counts in whole units. You can’t have 3.5 defects on a production line. You can’t have half a customer complaint. Discrete data comes from counting, and the result is always a whole number.
Continuous data measures along a scale that can, in principle, take any value, including fractions and decimals, within some range. Weight, time, temperature, distance. Continuous data comes from measuring, not counting, and it can always be made more precise with a finer instrument.
| Factor | Discrete Data | Continuous Data |
| How it’s generated | Counting | Measuring |
| Can it include decimals? | No | Yes |
| Example | Number of errors per shift | Time to complete a task |
| Typical Six Sigma source | Pass/fail inspection, defect tally | Caliper reading, stopwatch, scale |
Also Read: SSDSI Helped the Nurses’ Health Studies Improve Operations and Research Data Quality
Why Continuous Data Is More Statistically Powerful?
Here’s the single most valuable, most commonly overlooked fact about quantitative data, and it has real practical consequences for how you run a Six Sigma project.
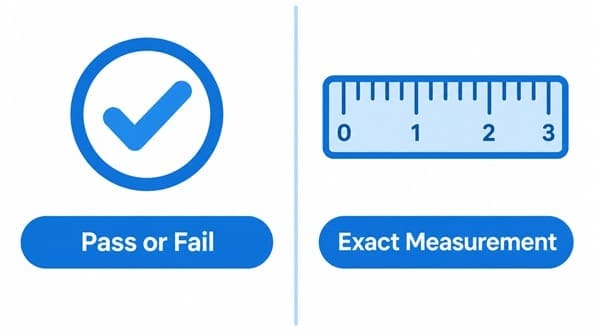
Discrete, attribute-style data conveys significantly less information per observation than continuous variable data does. A pass/fail inspection tells you one bit of information: did this unit meet spec or not. A precise measurement of that same unit tells you exactly how close to spec it landed, in which direction, and by how much.
This difference shows up directly in sample size requirements. A Gage R&R study, measurement system analysis used to confirm a gage is reliable, typically needs far fewer parts and trials when using continuous data than when using attribute (pass/fail) data to reach the same statistical confidence.
A study built on continuous measurements might need 10 parts and 2 to 3 operators. The equivalent attribute-based study often needs several times that volume of samples just to reach a comparable confidence level.
The practical lesson here is straightforward. Whenever you have a real choice between counting something as pass/fail and measuring it on a continuous scale, the continuous measurement will almost always get you a statistically sound answer with less data collection effort. This is exactly why experienced Six Sigma practitioners push hard to convert attribute data into continuous data wherever the process allows it.
A Worked Example: Converting Attribute Data Into Continuous Data
A team inspecting a machined part currently records each unit as “pass” or “fail” against a diameter tolerance. This is discrete, attribute data.
Instead, the team switches to recording the actual diameter measurement in millimeters for each part. This is now continuous data.
What changed practically?
Before, a run of 50 “pass” results told the team almost nothing about how close those parts sat to the tolerance edge. After switching to continuous measurement, the same 50 data points reveal the actual distribution: how tightly the process clusters around target, whether it’s drifting toward one tolerance limit, and how much margin remains before a real failure. The attribute data could only ever tell the team whether a boundary was crossed. The continuous data tells the team how the whole process actually behaves.
Not Every Number Is Quantitative Data
This is a genuinely common mistake, and it’s worth stating directly. A number’s appearance does not decide whether it’s quantitative data. Its actual meaning does.
A zip code is a number, but it’s not quantitative. You can’t average two zip codes and get a meaningful result. The same goes for an employee ID number, a phone number, or a numeric category code used to label a department. These are all qualitative data wearing numeric disguises.
A simple test separates the two. Ask: does adding, subtracting, or averaging this number produce a result that means something real? If yes, it’s quantitative. If the math produces nonsense, it’s qualitative, no matter how numeric it looks on the page.
How Quantitative Data Connects to Interval and Ratio Scales
Quantitative data itself splits one level further, into two measurement scales, which decides exactly which math operations are valid.
Interval-scaled data has equal spacing between values but no true zero point. Temperature in Celsius is the classic example. Zero degrees doesn’t mean “no temperature exists.” You can add and subtract interval data meaningfully, but ratios don’t make sense: 20 degrees isn’t “twice as hot” as 10 degrees.
Ratio-scaled data has equal spacing and a true, meaningful zero. Weight, time, and distance are ratio data. Zero pounds means no weight at all, and a ratio like “twice as heavy” is meaningful.
| Scale | Has True Zero? | Can You Calculate Ratios? | Example |
| Interval | No | No | Temperature (Celsius) |
| Ratio | Yes | Yes | Weight, cycle time, defect count |
Nearly all quantitative data used in Six Sigma work is ratio-scaled. Interval-scaled data shows up less often in process improvement work, but the distinction matters whenever a team is tempted to state a result as a ratio, since that claim is only valid on a true ratio scale.
Also Read: Do Employers Value Lean Six Sigma Certifications? The Data Answers the Question.
Statistical Tools That Work With Quantitative Data
Because quantitative data supports real arithmetic, it opens up a much wider set of statistical tools than qualitative data allows.
| Tool | What It Requires |
| Mean and standard deviation | Quantitative data, either discrete or continuous |
| t-test | Continuous data, comparing means between groups |
| ANOVA | Continuous data, comparing means across three or more groups |
| Regression analysis | Continuous data for the response variable |
| X-bar and R control chart | Continuous (variable) data |
| p-chart, np-chart, c-chart, u-chart | Discrete (attribute) data specifically |
Notice that discrete data still has its own dedicated control charts. It’s not that discrete data is unusable. It’s that, given a real choice, continuous data generally produces a more statistically efficient analysis for the same amount of data collection effort.
How Quantitative Data Fits Into a Six Sigma Project
Data type classification happens during the Measure step of DMAIC, before any statistical analysis begins. This decision shapes every tool choice that follows it.
A team measuring customer complaints by category (billing, shipping, product defect) is working with qualitative, nominal data. A team measuring the exact dollar value of each complaint is working with quantitative, continuous data. Both might describe the same underlying problem, but they support completely different analysis paths. Getting this classification right at the start prevents a team from applying the wrong statistical test three steps later.
Common Mistakes When Working With Quantitative Data
Treating a numeric code as quantitative data. A customer ID number or a product code is not quantitative, no matter how numeric it looks, since averaging it produces no meaningful result.
Defaulting to attribute (pass/fail) data when continuous measurement was actually available. This often happens simply because pass/fail tracking feels easier to set up, even when it requires significantly more samples to reach the same statistical confidence.
Confusing discrete and continuous when designing a control chart. Using an attribute chart on continuous measurement data, or the reverse, produces a chart that doesn’t correctly represent the process’s actual behavior.
Claiming a ratio on interval-scaled data. Saying a temperature is “twice as hot” only makes sense on a true ratio scale, not an interval scale like Celsius, where zero doesn’t represent the absence of the quantity.
Frequently Asked Questions on Quantitative Data
What is quantitative data in simple terms?
Quantitative data is information expressed as a number that represents a real quantity, something measured or counted, which supports real math like averaging, adding, and statistical testing.
What is the difference between discrete and continuous quantitative data?
Discrete data comes from counting and only takes whole-number values, like the number of defects on a shift. Continuous data comes from measuring and can take any value within a range, including decimals, like cycle time or weight.
Why does continuous data need a smaller sample size than discrete data?
Continuous data carries more statistical information per observation than discrete, attribute-style data. A pass/fail result tells you only whether a boundary was crossed, while a precise measurement tells you exactly how close to that boundary the result landed, which is why continuous data often reaches the same statistical confidence with far fewer samples.
Is a zip code or ID number quantitative data?
No. Even though these look numeric, they don’t represent a real quantity, and averaging or performing arithmetic on them produces a meaningless result. These are qualitative, nominal data despite their numeric appearance.
What statistical tools require quantitative data?
Tools like the t-test, ANOVA, regression analysis, and X-bar and R control charts all require quantitative data, typically continuous, since they rely on calculations like the mean and standard deviation that don’t apply to categorical data.
What is the difference between interval and ratio quantitative data?
Interval data has equal spacing between values but no true zero point, like temperature in Celsius. Ratio data has equal spacing and a true, meaningful zero, like weight or time, which means ratio comparisons like “twice as much” are mathematically valid.
How is quantitative data used in a Six Sigma project?
Quantitative data classification happens during the Measure step of DMAIC, and it determines which statistical tools and control charts a team can correctly apply later in the Analyze and Control steps.
Final Words
Quantitative data earns its usefulness from one property: the numbers mean something real enough to do math on. Splitting it into discrete and continuous types isn’t just a classification exercise. It has a direct, practical payoff, since continuous data generally carries more statistical information per observation, letting a team reach the same confidence level with meaningfully less data collection.
The most common mistake isn’t misunderstanding this distinction in theory. It’s defaulting to attribute, pass/fail tracking out of habit, when a continuous measurement was available all along and would have gotten the team a statistically sound answer with far less effort.
Build Your Statistical Foundation with SSDSI
Knowing when to push for continuous measurement instead of settling for attribute data is a skill that pays off in every DMAIC project afterward.
SSDSI delivers IASSC-accredited Green Belt and Black Belt training that covers data classification, measurement system analysis, and the full statistical toolkit used in real process improvement work, through onsite, live virtual, public, and self-paced formats.
SSDSI has certified 5,322+ professionals across 600+ organizations in 52 cities, backed by a 5-star Google review rating. If you want to build this foundation properly, a conversation about the right certification path is a solid next step.
About Six Sigma Development Solutions, Inc.
Six Sigma Development Solutions, Inc. offers onsite, public, and virtual Lean Six Sigma certification training. We are an Accredited Training Organization by the IASSC (International Association of Six Sigma Certification). We offer Lean Six Sigma Green Belt, Black Belt, and Yellow Belt, as well as LEAN certifications.
Book a Call and Let us know how we can help meet your training needs.


