
Confidence level is the long-run success rate of an estimation procedure, the percentage of the time that method would produce an interval containing the true population value, if you repeated the sampling process many times.
It is not, despite how almost everyone describes it, the probability that one specific interval you calculated actually contains the true value. This distinction sounds academic, but it is one of the most widely misinterpreted ideas in statistics, and it shapes how confidently a Six Sigma team should act on a single confidence interval from a single sample.
This guide explains what confidence level technically measures, why the common “95% chance it’s in here” explanation is wrong, and what that means practically for choosing between 90%, 95%, and 99% confidence in real project work.
| Statement | Correct or Incorrect | Why |
| “There is a 95% probability the true value lies in this specific interval.” | Incorrect | The true value is fixed; it either is or isn’t in this interval. The 95% describes the method’s long-run performance. |
| “If I repeated this sampling process many times, 95% of the resulting intervals would contain the true value.” | Correct | This describes the confidence level’s actual, technical meaning. |
| “95% confidence means the sample data has a 95% chance of being typical.” | Incorrect | Confidence level applies to the interval-generating procedure, not to any individual sample’s typicality. |
| “A wider confidence interval always means a higher confidence level.” | Incorrect | Interval width depends on confidence level, sample size, and variability together, not confidence level alone. |
| “Confidence level and significance level (alpha) are related.” | Correct | Confidence level equals 1 minus alpha; a 95% confidence level corresponds to a 5% significance level. |
Table of contents
Key Takeaways
- Confidence level describes a procedure, not a single result. It tells you how often the method of building an interval would succeed in capturing the true population value across many repeated samples, not the odds that this particular interval succeeded.
- The most common misstatement, “there is a 95% probability the true value is in this interval,” is technically incorrect in classical (frequentist) statistics, because the true population value is treated as fixed, not random.
- Confidence level and confidence interval are different concepts working together. Confidence level is the reliability rating of the method; the confidence interval is the actual range of values that method produces from your specific sample.
- Confidence level equals 1 minus alpha (the significance level) used in hypothesis testing, which means a 95% confidence level corresponds directly to the standard 0.05 alpha most Six Sigma hypothesis tests use.
- Raising your confidence level without increasing your sample size only widens your interval, it doesn’t make your specific conclusion more certain, a tradeoff many teams get backward.
What Is Confidence Level?
Confidence level is the percentage that describes how reliable an estimation procedure is over the long run, specifically, the proportion of intervals that procedure would produce that actually contain the true population parameter, if the sampling process were repeated an enormous number of times. It is a property of the method, not a property of any one interval that method happens to produce.
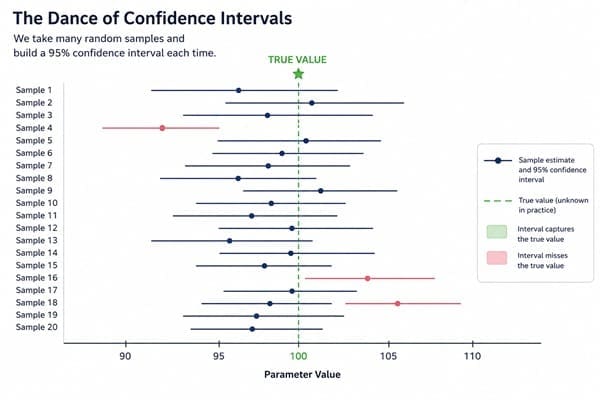
This is a subtle but important shift from how most people, including many experienced professionals, instinctively think about it. According to a widely cited explanation of confidence intervals, if you draw the same-sized sample repeatedly and construct a confidence interval from each one using the same method, a certain percentage of those intervals, matching your chosen confidence level, will contain the true population value; the rest will not.
You never know, looking at any single interval, whether it’s one of the successful ones or one of the misses. The 95% doesn’t describe that one interval; it describes the track record of the method that built it.

Public, Onsite, Virtual, and Online Six Sigma Certification Training!
- We are accredited by the IASSC.
- Live Public Training at 52 Sites.
- Live Virtual Training.
- Onsite Training (at your organization).
- Interactive Online (self-paced) training,
The Misconception Almost Everyone Repeats
Here is the detail that separates a genuinely accurate explanation of confidence level from the version most glossaries and even textbooks casually repeat. Saying “there is a 95% probability the true value falls within this specific interval” feels natural, but in classical frequentist statistics, it is not correct.
The reason comes down to what “probability” means in this framework. According to statistical guidance on this exact issue, in frequentist statistics the population parameter you’re estimating is treated as a fixed, unknown constant, not a random variable that moves around.
A specific calculated interval, say, 53.2 to 57.2 seconds, either contains that fixed true value or it doesn’t; there’s no 95%-versus-5% probability left to assign to it once it’s calculated. The 95% belongs to the process that generated the interval, evaluated across an imagined infinite series of repetitions, not to this one outcome of that process.
This has been called the “dance of confidence intervals”: imagine running the same study over and over, each time producing a slightly different interval. Across that entire dance, about 95% of the intervals would land on the true value and about 5% would miss it. Your one study is a single step in that dance. It’s either a hit or a miss, you just can’t know which from the interval alone.
Also Read: How Difficult Is the Lean Six Sigma Exam? What the Facts Show by Belt Level
Confidence Level vs. Confidence Interval: Two Related but Different Things
These terms get used almost interchangeably in casual conversation, but they answer different questions. Confidence level is the reliability rating you choose before collecting data, typically 90%, 95%, or 99%, describing how often your chosen method would succeed across repeated use. Confidence interval is the actual range of values, calculated from your specific sample, that the method produces once you apply it.
Put another way: confidence level is a property you select in advance, based on how much risk of being wrong you’re willing to accept.
The confidence interval is the output you get after plugging your real data into that method. If you want the mechanics of how interval width is actually calculated, including margin of error and sample size formulas, that’s covered in more depth on our Confidence Interval glossary page; this article focuses specifically on what the confidence level percentage itself actually represents.
Why This Distinction Actually Matters on a Six Sigma Project
This isn’t just a semantic argument for statisticians. Misunderstanding confidence level leads to a specific, practical overconfidence trap in real process improvement work.
A team that calculates a 95% confidence interval for a process capability metric, and then tells leadership “we’re 95% sure the true capability is in this range,” is technically overstating what the analysis actually established for that single study.
The more accurate framing is that the method used to build that interval succeeds 95% of the time across repeated use, and this particular result is one application of that method. In most everyday project communication, this distinction changes little about the decision.
But in high-stakes situations, safety-critical processes, regulatory submissions, or decisions with significant financial exposure, understating the uncertainty behind a single confidence interval by treating it as a near-certain probability statement can lead a team to act with more confidence than the data actually supports.
Confidence Level and Hypothesis Testing: The Alpha Connection
You should know that Confidence level isn’t an isolated concept; it’s mathematically tied to the significance level (alpha) used throughout Six Sigma hypothesis testing. Confidence level equals 1 minus alpha. A 95% confidence level corresponds directly to the standard alpha of 0.05 used in most Six Sigma hypothesis tests, meaning you’re accepting a 5% risk of a Type I error, incorrectly concluding a difference or effect exists when it actually doesn’t.

This connection is useful in practice: choosing a confidence level for an interval and choosing a significance level for a related hypothesis test should generally be treated as the same decision, made together, rather than two separate, disconnected choices made at different points in a project.
Choosing a Confidence Level: 90% vs. 95% vs. 99%
The right confidence level depends on how costly a wrong conclusion would be, not on a desire to appear more rigorous.
A 90% confidence level suits exploratory analysis or initial screening, where the cost of an occasional miss is low and a tighter interval is more useful for quick decisions. 95% confidence is the standard working level for most DMAIC analysis, root cause validation, and improvement confirmation. 99% confidence is reserved for higher-stakes decisions, safety-critical processes, regulated industries, or situations where a false conclusion carries serious consequences.
One frequently overlooked tradeoff: raising your confidence level from 95% to 99% without also increasing your sample size doesn’t make your conclusion more certain, it simply produces a wider, less precise interval. Confidence level and sample size need to be planned together before data collection begins, not adjusted independently after the fact.
Also Read: How Six Sigma Can Measure Your Process Waste Level?
Real Examples of Confidence Level in Practice
Manufacturing: Process Capability Claims
A quality engineer reports a Cpk estimate with a 95% confidence interval to a customer audit. Framing it correctly, “our estimation method captures the true capability 95% of the time it’s used this way,” rather than “there’s a 95% chance the true capability is in this range,” keeps the claim technically accurate under scrutiny.
Call Center: Average Handle Time
A Black Belt calculates a 95% confidence interval for average call handle time and finds it does not include a customer complaint threshold that management assumed was being exceeded, correctly resolving a dispute about whether the process was actually underperforming.
Pharmaceutical: Regulatory Submission Data
A validation team uses 99% confidence for a process parameter submitted to a regulator, reflecting the higher cost of a false conclusion in a safety-critical, regulated context compared to standard internal DMAIC work.
Common Mistakes When Working With Confidence Level
- Saying “there’s a 95% chance the true value is in this interval.” This is the single most common misstatement, and it misrepresents what the confidence level actually measures.
- Treating confidence level as a measure of data quality. It describes the reliability of the estimation method, not whether your specific sample was representative or well-collected.
- Raising confidence level to sound more rigorous, without adjusting sample size. This only widens the interval; it doesn’t strengthen the underlying conclusion.
- Confusing confidence level with confidence interval. One is a percentage you choose in advance; the other is the range of values that results from applying it to your data.
- Ignoring the alpha connection in hypothesis testing. Choosing a confidence level and a significance level independently, rather than as one linked decision, produces inconsistent risk tolerance across an analysis.
Frequently Asked Questions (FAQs) on Confidence Level
What does a 95% confidence level actually mean?
It means that if the same sampling and interval-construction procedure were repeated many times, about 95% of the resulting intervals would contain the true population value. It does not mean there’s a 95% probability the true value is in this one specific interval you calculated.
Is “there’s a 95% chance the true value is in this interval” wrong?
Yes, in classical frequentist statistics. The true population value is treated as a fixed, unknown constant, not a random variable, so no probability can be attached to whether it falls in one already-calculated interval. The 95% describes the method’s long-run success rate instead.
What is the difference between confidence level and confidence interval?
Confidence level is the percentage reliability rating chosen before analysis, typically 90%, 95%, or 99%. The confidence interval is the actual calculated range of values produced by applying that method to your specific sample data.
How is confidence level related to alpha in hypothesis testing?
Confidence level equals 1 minus alpha. A 95% confidence level corresponds to the standard alpha of 0.05 used in most Six Sigma hypothesis tests, representing a 5% accepted risk of a Type I error.
Does a higher confidence level mean a more accurate result?
Not by itself. A higher confidence level without a corresponding increase in sample size only produces a wider, less precise interval. Confidence level and sample size should be planned together to actually improve the reliability of a conclusion.
Conclusion
Confidence level is a rating for a method’s long-run reliability, not a probability statement about the one interval sitting in front of you. Getting this distinction right doesn’t change most day-to-day project decisions, but it changes how a Six Sigma practitioner should talk about certainty in high-stakes situations, and it’s the kind of precision that separates someone who memorized a definition from someone who actually understands the statistics behind it.
Six Sigma Development Solutions Inc. teaches confidence level, confidence intervals, and the full sampling and hypothesis testing toolkit through onsite, live virtual, public, and online formats. Our Green Belt and Black Belt certification courses work through real interval calculations and interpretation practice, not just definitions. View our upcoming Green Belt and Black Belt training schedule and get $500 off your next class.
About Six Sigma Development Solutions, Inc.
Six Sigma Development Solutions, Inc. offers onsite, public, and virtual Lean Six Sigma certification training. We are an Accredited Training Organization by the IASSC (International Association of Six Sigma Certification). We offer Lean Six Sigma Green Belt, Black Belt, and Yellow Belt, as well as LEAN certifications.
Book a Call and Let us know how we can help meet your training needs.


