
A data collection plan is a structured document that specifies exactly what data a Six Sigma team will collect, how they will collect it, who will collect it, and when. It is created in the Measure phase of DMAIC and used as the foundation for every analytical decision that follows. Without a data collection plan, teams collect the wrong data, collect it inconsistently, or collect it from the wrong point in the process. The downstream result is analysis built on unreliable information — which produces improvements that do not hold.
Table of contents
Meaning of Data Collection Plan in Six Sigma
A data collection plan is a detailed document created in the DMAIC Measure phase that outlines the specific data a project team will collect to establish baseline process performance. According to Go Lean Six Sigma, it includes where to collect data, how to collect it, when to collect it, and who will do the collecting. It also specifies an operational definition for each measure — a precise, written description of exactly how the measurement will be taken.
A solid data collection plan ensures that all team members collect data the same way, that the data is transmitted to the right stakeholders, and that the data collected is actually relevant to the project’s objective.
Key Takeaways
- A data collection plan is created during the Measure phase of DMAIC and specifies what data to collect, how to collect it, who collects it, when, and from where.
- The plan is built after the SIPOC diagram and project charter confirm the project Y (the primary metric) and the process steps under investigation.
- Every measure in the plan requires an operational definition — a precise written description of exactly how that measure is observed or calculated. Operational definitions prevent inconsistent data collection across operators and locations.
- A complete data collection plan template includes eight columns: measure, data type, operational definition, specification/target, data source, collection method, sample size, and frequency.
- Data type — continuous or attribute — determines which control chart and statistical test applies. Collecting continuous data but plotting it on an attribute chart wastes precision.
- A data collection plan applies across all DMAIC phases. The Define phase scopes what data is needed. The Measure phase builds and executes the plan. The Analyze, Improve, and Control phases use the data it produces.

Public, Onsite, Virtual, and Online Six Sigma Certification Training!
- We are accredited by the IASSC.
- Live Public Training at 52 Sites.
- Live Virtual Training.
- Onsite Training (at your organization).
- Interactive Online (self-paced) training,
What Is a Data Collection Plan?
A data collection plan transforms a vague intention to “gather data” into a specific, repeatable protocol. It defines every decision that affects how data is collected before the first measurement is taken.
Master of Project Academy describes it as “a detailed document that describes the exact steps as well as the sequence that needs to be followed in gathering the data for the given Six Sigma project.” The plan is not a summary written after data collection. It is a specification written before data collection begins.
The reason this matters is that Six Sigma data collection involves multiple people, locations, and time periods. A process that runs across three shifts over four weeks with two operators per shift produces data from six different humans.
If each person measures slightly differently, records data in different formats, or samples at different times within the shift, the resulting dataset reflects measurement variation as much as process variation. The data collection plan prevents this by standardizing every decision upfront.
Also Read: Data Collection Sheet
Why Teams Build a Data Collection Plan?
The data collection plan answers a specific organizational need: it ensures that people who execute the data collection are working from the same specification as the people who designed the project.
SixSigma.us confirms this purpose directly: teams create a data collection plan to “establish what data needs to be collected, how they will be collected, and who will collect them” — and to make sure that the resulting data is actually valid for the analytical purpose it serves.
Three specific problems arise without a data collection plan.
Collecting the wrong data. Teams frequently collect data that is available rather than data that is relevant. Measuring cycle time at a downstream step when the bottleneck occurs upstream produces a dataset that cannot answer the project’s root cause questions.
Inconsistent collection. Without a written protocol, two operators measuring the same thing at the same point produce different values because they define the measurement differently. One operator measures from the edge of the part. Another measures from the center. The data looks like process variation. It is measurement system variation.
Missing data. Teams discover mid-analysis that a key variable was not recorded during the collection period. Returning to collect missing data interrupts normal operations and introduces collection-period differences into the analysis.
A data collection plan eliminates all three problems by defining the protocol before collection begins.
The Eight Columns of a Data Collection Plan Template
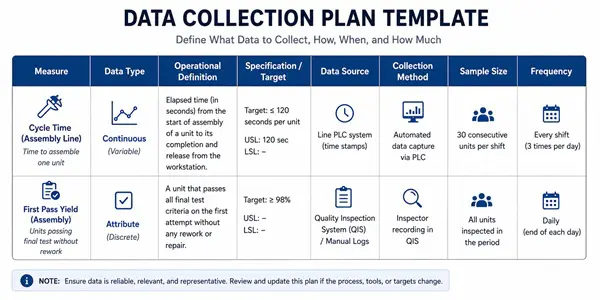
A complete data collection plan template contains eight columns. Each column removes one source of ambiguity from the data collection process.
Column 1: Measure
The measure column names the specific variable being collected. It corresponds directly to the project Y (primary metric) or to an X variable (potential input) that the team needs to measure.
Examples: cycle time, defect count per unit, tablet weight, first-call resolution status, customer wait time.
Each measure should describe a single, specific quantity. “Quality” is not a measure. “Dimensional tolerance on Feature A, in millimeters” is a measure.
Column 2: Data Type
The data type column specifies whether the measure produces continuous data or attribute data.
Continuous data takes any value within a range and is measured on a scale. Temperature, weight, cycle time, and dimensions are continuous. Continuous data supports richer statistical analysis and is more sensitive to detecting process shifts.
Attribute data classifies each unit into one of two or more discrete categories. Pass/fail, defective/conforming, error/no error, and yes/no are attribute measures. Attribute data is simpler to collect but less statistically powerful than continuous data.
The data type determines which control chart to use in the Control phase and which hypothesis test applies in the Analyze phase. Identifying data type in the plan prevents the common mistake of selecting the wrong statistical tool later.
Column 3: Operational Definition

The operational definition is the most important column in the plan. It is a precise, written description of exactly how the measure will be taken. It removes every source of ambiguity that could cause two collectors to produce different results on the same part or transaction.
A complete operational definition answers four questions:
- What exactly is being measured?
- Where in the process is it measured?
- Which instrument or method is used?
- How is the measurement recorded?
Example of a weak operational definition: “Measure cycle time.”
Example of a strong operational definition: “Record the time from when the order is stamped with the receipt timestamp to when the shipment confirmation email is sent, measured to the nearest minute using the order management system timestamp log.”
The strong definition produces consistent results regardless of who collects the data. The weak definition produces results that reflect individual interpretations.
Column 4: Specification or Target
This column records the customer specification limit (for a primary metric tied to a CTQ) or the team’s expected data range (for input variables). It gives collectors a reference point for recognizing obvious data errors during collection.
Examples: 10.00 mm ± 0.05 mm tolerance; on-time delivery target = 95%; target tablet weight = 500 mg ± 5 mg.
Column 5: Data Source
The data source column specifies exactly where the data comes from. This means the precise process step, machine, system, or record location — not a general department name.
Examples: CNC Machine 3, Cell B, Line 1; SAP order management module, shipment confirmation table; Incoming inspection station, bench gauge serial number 1042.
Specifying the source prevents data being collected from a neighboring step or a different system that measures the same thing slightly differently.
Column 6: Collection Method
The collection method column specifies how the data will be recorded. Options include manual check sheets, automated system exports, digital measurement instruments with direct data logging, manual observation checklists, or database queries.
The method affects repeatability. An automated measurement instrument with direct data logging produces less operator-induced variability than a manual caliper reading recorded on paper.
Column 7: Sample Size
The sample size column specifies how many units or observations the team will collect per sampling period. The sample size must be large enough to support the statistical analysis planned for the Measure phase.
For continuous data process capability studies, a minimum of 30 observations is a common starting guideline. Larger samples (100 or more) produce more stable capability estimates. For attribute data, sample sizes are typically larger because attribute data carries less information per observation than continuous data.
The Six Sigma Study Guide notes that sample size determination depends on the variation in the characteristic being measured and the desired confidence level. Teams that skip the sample size calculation and collect an arbitrary number of observations risk underpowering their capability analysis.
Column 8: Frequency and Timing
The frequency column specifies when data will be collected and at what interval. This includes the start and end dates of the collection period, the sampling interval (every unit, every 10th unit, hourly, every shift, daily), and whether the collection covers the full operating period or specific windows within it.
Timing matters because processes change over time. A collection period that covers only one shift or only daytime hours produces a baseline that does not reflect 24-hour process behavior.
Some data collection plans add a ninth column for the Standard Operating Procedure (SOP) reference that governs the collection activity. This column links the plan to existing documented procedures, ensuring that collection activities conform to established standards.
How to Build a Data Collection Plan: Step by Step
Step 1: Review the project charter and SIPOC. Confirm the project Y (primary metric), the process boundaries from the SIPOC diagram, and the customer specification limits from the CTQ tree. These inputs define what the plan must measure.
Step 2: List every measure the project requires. Include the primary metric (project Y) and any X variables identified during the Define phase as potential root causes. Each measure gets its own row in the data collection plan template.
Step 3: Classify each measure as continuous or attribute. Wherever a choice exists, prefer continuous measurement over attribute measurement. Continuous data produces more precise capability estimates and more powerful hypothesis tests.
Step 4: Write an operational definition for every measure. This step takes the most time and saves the most problems downstream. For each measure, answer the four operational definition questions: what, where, how, and in what units.
Step 5: Record the specification or target for each measure. Pull specification limits from the customer’s CTQ. If no customer specification exists for a particular input variable, record the expected normal operating range as the target.
Step 6: Identify the data source for each measure. Specify the exact machine, database, process step, or record location. Walk the process if necessary to confirm that the data actually exists at the specified source and in the expected format.
Step 7: Choose the collection method for each measure. Select automated data capture where it is available and valid. Document any manual collection steps precisely enough that any trained team member can execute them identically.
Step 8: Calculate sample sizes and set the collection schedule. Determine the minimum sample size needed for the planned analysis. Set a collection window that covers the full range of normal process conditions: all shifts, all operators, all relevant material lots.
Also Read: Multi-Vari Data Collection
The Measurement System Validation Connection
Building a data collection plan does not guarantee reliable data. The plan specifies what data to collect and how. Measurement System Analysis (MSA) — specifically Gauge R&R — validates that the instruments and operators used in the plan actually produce reliable measurements.
SixSigma.us states directly: “Quality teams must evaluate their measurement systems to ensure reliable data collection. Gauge R&R studies assess measurement precision and accuracy.”
A Gauge R&R study checks two things. Repeatability confirms that the same operator gets the same result when measuring the same part multiple times. Reproducibility confirms that different operators get the same result on the same part.
A measurement system contributing more than 10% of the tolerance to measurement variation is marginal. More than 30% is unacceptable. If the measurement system fails the Gauge R&R before data collection begins, every data point collected afterward reflects instrument or operator variability, not true process performance.
MSA is therefore not optional. It must be completed and the measurement system confirmed as acceptable before the data collection plan is executed.
Common Mistakes in Data Collection Plans
Six mistakes appear repeatedly when teams build or execute a data collection plan.
Skipping the operational definition. This is the most common and most damaging mistake. Without an operational definition, two collectors produce different results on the same measurement, and the variation looks like a process problem.
Collecting the wrong data type. Recording a continuous variable as pass/fail (attribute) because it is easier loses statistical information. Always measure continuously when the process and instrument allow it.
Under-sampling. Collecting 15 observations when the analysis requires 30 produces an unreliable capability estimate. Calculate sample size before finalizing the plan.
Sampling only during peak hours or favourable shifts. A baseline that does not represent normal operating conditions produces an improvement target that is easier to hit than it should be.
Failing to validate the measurement system. Running the data collection plan with an unvalidated gauge produces data that reflects measurement system error as much as process performance.
Not documenting the plan before collection begins. Teams that collect data first and document later cannot confirm that collection was consistent. Documentation after the fact is not a data collection plan.
Data Collection Plan Across DMAIC Phases
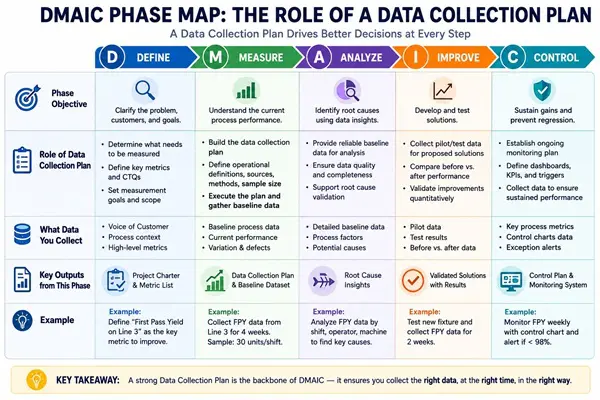
The data collection plan is created in the Measure phase but its outputs feed every subsequent phase.
| DMAIC Phase | Data Collection Plan Role |
| Define | The project charter and SIPOC identify the primary metric and process boundaries that determine what the plan must measure |
| Measure | The data collection plan is built and executed to produce baseline data for capability analysis and control chart setup |
| Analyze | Baseline data from the Measure phase feeds root cause analysis, hypothesis testing, and regression models |
| Improve | Pilot data is collected using the same or a revised plan to compare against the Measure phase baseline |
| Control | Ongoing monitoring uses a control phase data collection protocol to feed SPC charts and confirm sustained improvement |
Frequently Asked Questions: Data Collection Plan
Q: What is a data collection plan in Six Sigma?
A: A data collection plan is a structured document created in the Measure phase of DMAIC that specifies what data the project team will collect, how they will collect it, who will collect it, and when. It includes an operational definition for every measure, the data type (continuous or attribute), the data source, the collection method, the sample size, and the collection frequency. It ensures consistent data collection across operators, shifts, and locations.
Q: What is an operational definition and why does it matter?
A: An operational definition is a precise, written description of exactly how a measure is observed or calculated. It specifies what is being measured, where in the process it is measured, which instrument is used, and how the result is recorded. Operational definitions matter because without them, two collectors measuring the same thing will produce different results based on their individual interpretation. This makes the data look like process variation when it is actually measurement system variation.
Q: What are the eight columns of a data collection plan?
A: The eight standard columns are: measure (the specific variable), data type (continuous or attribute), operational definition (precise collection protocol), specification or target (customer requirements or normal range), data source (exact location in the process), collection method (instrument, system, or manual procedure), sample size (number of observations per period), and frequency and timing (when and how often to collect).
Q: What is the difference between continuous and attribute data in a data collection plan?
A: Continuous data is measured on a numeric scale and can take any value within a range — weight, temperature, cycle time, and dimensions are continuous. Attribute data classifies each unit into a category — pass/fail, defective/conforming, on-time/late. Continuous data is more statistically powerful and more sensitive to detecting process shifts. The data type determines which control chart and hypothesis test to use in later DMAIC phases.
Q: Does a data collection plan include Gauge R&R?
A: Gauge R&R is not a column in the data collection plan itself, but it must be completed before executing the plan. MSA validates that the measurement instruments and operators specified in the plan produce reliable, repeatable results. If the measurement system fails Gauge R&R, all data collected using it is unreliable regardless of how carefully the plan was written.
Q: When is the data collection plan created in DMAIC?
A: The data collection plan is created during the Measure phase of DMAIC. It is built after the Define phase has established the project Y (primary metric), the SIPOC diagram has mapped the process boundaries, and the CTQ tree has identified customer specification limits. The plan is then executed during the Measure phase to collect the baseline data that feeds Analyze, Improve, and Control.
Data Collection Plan Training in Six Sigma
Building a valid data collection plan is a core competency taught at the Green Belt level and refined at the Black Belt level. Green Belts learn to construct the eight-column template, write operational definitions, classify data types, and calculate sample sizes for their specific project context. Black Belts add expertise in MSA integration, multi-vari data collection designs, and cross-site data standardization.
At Six Sigma Development Solutions Inc., the data collection plan is taught as a hands-on skill in our Green Belt and Black Belt programs. Practitioners work through a complete plan for a real process, write operational definitions that pass peer review, and learn how to connect the plan to Gauge R&R validation.
We offer training in three formats:
- Onsite training — delivered at your facility, building the data collection plan for your actual DMAIC project during class.
- Live virtual training — instructor-led sessions online covering the full Measure phase curriculum including data collection plan construction and MSA.
- Online training — self-paced Green Belt and Black Belt certification programs covering all IASSC-testable Measure phase content.
Explore our Six Sigma training programs or contact our team to find the right program for your goals.
About Six Sigma Development Solutions, Inc.
Six Sigma Development Solutions, Inc. offers onsite, public, and virtual Lean Six Sigma certification training. We are an Accredited Training Organization by the IASSC (International Association of Six Sigma Certification). We offer Lean Six Sigma Green Belt, Black Belt, and Yellow Belt, as well as LEAN certifications.
Book a Call and Let us know how we can help meet your training needs.


