
The c-chart is an attribute control chart that monitors the total count of defects in a constant-size inspection unit. It uses the Poisson distribution to calculate its control limits. The centerline is the average number of defects per unit (c-bar). The Upper Control Limit (UCL) is c-bar plus 3 times the square root of c-bar.
The Lower Control Limit (LCL) is c-bar minus 3 times the square root of c-bar, set to zero if the result is negative. Use a c-chart when your sample size is constant. Use a u-chart when sample size varies.
Table of contents
Key Takeaways
- The c-chart counts total defects, not defective units. A single unit can contribute multiple defects to the count.
- The c-chart requires constant sample size. Every subgroup must cover the same number of inspection units. If sample size varies, use a u-chart instead.
- The c-chart is based on the Poisson distribution. This distribution describes count data where defects are rare but the opportunity for them is large.
- The centerline (c-bar) is the average defect count across all subgroups: total defects divided by the number of subgroups.
- UCL = c-bar + 3√c-bar. LCL = c-bar − 3√c-bar. If LCL is negative, set it to zero.
- There are four attribute control charts. The c-chart and u-chart count defects. The p-chart and np-chart count defective units.
- The c-chart appears in the Measure and Control phases of DMAIC. In Measure, it confirms process stability before capability analysis. In Control, it monitors the improved process.
- Five out-of-control signals apply to the c-chart: points beyond control limits, runs of 7+ consecutive points on one side, trends of 7+ consecutive points in one direction, cycles, and hugging.
- The c-chart is covered in the IASSC Green Belt and Black Belt Body of Knowledge under the Control phase attribute control chart content.
What Is a C-Chart?
The c-chart is an attribute control chart. It tracks the total number of defects found in each inspection unit.
Key distinction: defects vs defectives
A defect is a single nonconformance on a unit. A defective unit is a unit that has one or more defects.
The c-chart counts defects. One unit can contribute 5 defects to the count.
The p-chart counts the proportion of defective units. One unit is either pass or fail, regardless of how many defects it has.
This distinction determines which chart you use.

Public, Onsite, Virtual, and Online Six Sigma Certification Training!
- We are accredited by the IASSC.
- Live Public Training at 52 Sites.
- Live Virtual Training.
- Onsite Training (at your organization).
- Interactive Online (self-paced) training,
The Poisson Distribution: Why the C-Chart Uses It
The c-chart calculates its control limits using the Poisson distribution.
The Poisson distribution applies when three conditions hold:
- Defects occur randomly and independently of each other.
- The probability of a defect is the same for each part of the inspection unit.
- The inspection unit size is constant across all subgroups.
When these conditions hold, the standard deviation of the defect count equals the square root of the mean. This is why the UCL and LCL formulas use the square root of c-bar as the standard deviation estimate.
The Four Attribute Control Charts: Choosing the Right One
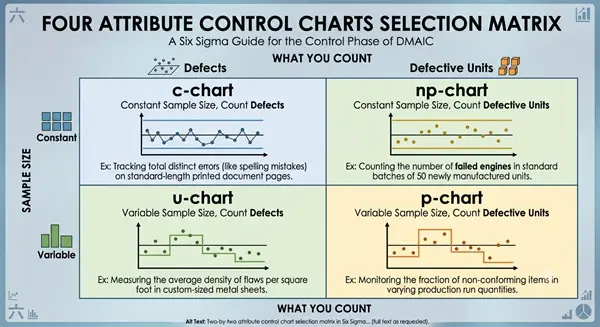
The c-chart is one of four attribute charts. The selection rule is straightforward.
| Chart | What It Counts | Sample Size | Distribution |
| c-chart | Total number of defects | Constant | Poisson |
| u-chart | Average defects per unit | Variable | Poisson |
| np-chart | Total number of defective units | Constant | Binomial |
| p-chart | Proportion of defective units | Variable | Binomial |
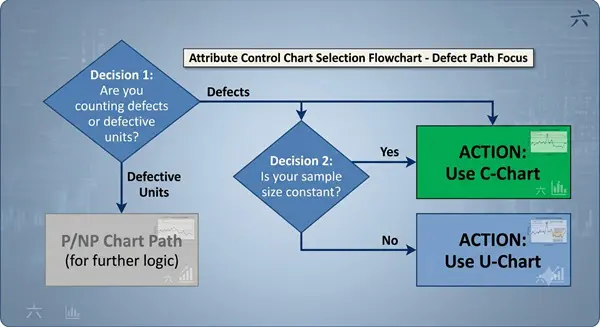
The two-step decision:
Step 1: Are you counting defects or defective units?
- Defects → c-chart or u-chart
- Defective units → np-chart or p-chart
Step 2: Is your sample size constant or variable?
- Constant → c-chart (defects) or np-chart (defectives)
- Variable → u-chart (defects) or p-chart (defectives)
C-Chart Formulas
Centerline
c-bar = Total defects across all subgroups divided by the number of subgroups
c-bar = Σc / k
Where Σc is the sum of all defect counts and k is the number of subgroups.
Upper Control Limit (UCL)
UCL = c-bar + 3 × √c-bar
Lower Control Limit (LCL)
LCL = c-bar − 3 × √c-bar
Rule: If the calculated LCL is negative, set it to zero. You cannot have a negative count of defects.
Also Read: Measles Chart: Six Sigma Tool for Defect Tracking
Step-by-Step: How to Build a C-Chart
Step 1: Verify constant sample size
Confirm every subgroup covers the same number of inspection units. If not, switch to a u-chart.
Lean6SigmaHub states: “Collect at least 20 to 25 subgroups before establishing control limits to ensure reliable estimates.” (Source: Lean6SigmaHub, May 2026)
Step 2: Record defect counts
For each subgroup, record the total number of defects found across all units in that subgroup.
Step 3: Calculate the centerline
Divide the total defects across all subgroups by the number of subgroups.
Step 4: Calculate UCL and LCL
Apply the formulas above. Set LCL to zero if negative.
Step 5: Plot the chart
Plot defect count on the y-axis. Plot subgroup number or time on the x-axis. Draw the centerline, UCL, and LCL as horizontal lines.
Step 6: Interpret the chart
Apply the out-of-control rules described in the next section.
Worked Example: C-Chart for a Printed Circuit Board Line
A quality engineer inspects one printed circuit board (PCB) per shift. She counts all soldering defects on each board. Sample size is constant: one board per subgroup.
She collects 10 shifts of data (she would normally collect 20 to 25, but this example uses 10 for illustration):
| Shift | Defect Count |
| 1 | 4 |
| 2 | 7 |
| 3 | 3 |
| 4 | 8 |
| 5 | 5 |
| 6 | 6 |
| 7 | 4 |
| 8 | 9 |
| 9 | 3 |
| 10 | 5 |
Step 1: Calculate c-bar. Total defects = 4+7+3+8+5+6+4+9+3+5 = 54 Number of subgroups = 10 c-bar = 54 / 10 = 5.4
Step 2: Calculate UCL. UCL = 5.4 + 3 × √5.4 = 5.4 + 3 × 2.324 = 5.4 + 6.97 = 12.37
Step 3: Calculate LCL. LCL = 5.4 − 3 × √5.4 = 5.4 − 6.97 = −1.57 → Set to 0
Centerline = 5.4. UCL = 12.37. LCL = 0.
All 10 points fall within the control limits. The process is in statistical control.
Shift 8 (9 defects) is notably high but still within the UCL of 12.37. The engineer monitors subsequent shifts closely.
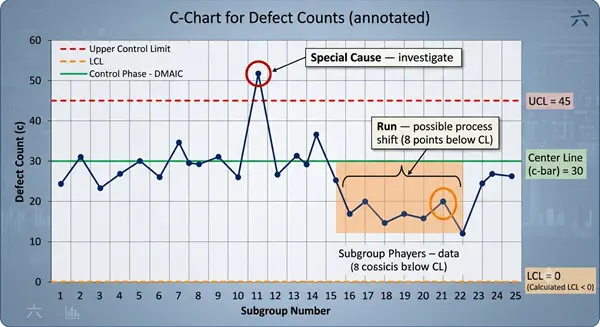
Interpreting the C-Chart: Five Out-of-Control Signals
Points within the control limits do not automatically mean the process is performing well. Look for these five signals:
Signal 1: Points beyond control limits Any single point above the UCL or below the LCL indicates a likely special cause. 6sigma.us confirms: “Any single point falling above the Upper Control Limit (UCL) or below the Lower Control Limit (LCL) is a strong indicator of a special cause. Approximately 99.73% of points should fall within the limits if only common cause variation is present.”
Signal 2: Runs Seven or more consecutive points all above or all below the centerline indicate a process shift. Lean6SigmaHub states: “Seven or more consecutive points all above or all below the center line suggest a shift in the process.”
Signal 3: Trends Seven or more consecutive points steadily increasing or decreasing indicate a developing problem. This often reflects gradual changes such as tool wear or material drift.
Signal 4: Cycles Repeated patterns of highs and lows may indicate systematic causes such as shift changes, maintenance schedules, or supplier rotation.
Signal 5: Hugging Points staying very close to the centerline without normal scatter may indicate data manipulation or a measurement recording error.
Note on points below the LCL: Lean6SigmaHub warns: “Treating a point below the LCL as automatically good news is a mistake. A defect count lower than the lower control limit is statistically unusual and warrants investigation — just like a point above the UCL. The cause might be a genuine process improvement worth understanding and standardizing. Or it might reflect a measurement or recording error.”
Also Read: What is Run Chart?
C-Chart vs U-Chart: The Key Decision
The c-chart and u-chart both use the Poisson distribution and both count defects. The decision between them is simple.
Use the c-chart when: Every subgroup covers exactly the same number of inspection units.
Use the u-chart when: The number of units inspected varies from subgroup to subgroup.
Six Sigma Study Guide confirms: “c chart requires that each subgroup’s sample size be the same.”
Anexas confirms the u-chart alternative: “u-chart is used when the sample size varies, such as the number of meals or bills delivered each day.”
Practical example:
You inspect five circuit boards per shift every shift. Sample size is always five. Use a c-chart.
You inspect however many boards are produced each day. Some days it is 20, some days 35. Use a u-chart.
C-Chart in DMAIC
The c-chart appears in two DMAIC phases.
Measure Phase
Before calculating process capability for a defect-count metric, you must verify the process is in statistical control. A c-chart serves this purpose.
Control Phase
After implementing improvements in the Improve phase, the c-chart monitors whether defect counts remain at the improved level. It detects shifts back toward the old performance baseline.
Anexas confirms: “c chart is used to determine if the process is stable and predictable and to monitor the effects of before and after process improvements.”
Running a C-Chart in Minitab
In Minitab, the c-chart is located at:
Stat > Control Charts > Attributes Charts > C
Select your defect count column. Specify the constant subgroup size. Minitab automatically calculates c-bar, UCL, and LCL. It flags out-of-control points in red.
Lean6SigmaHub confirms the Minitab path: “In Minitab, c charts and u charts are located under: Stat > Control Charts > Attributes Charts > C (for c charts).”
FAQ: C-Chart in Six Sigma
What is a c-chart in Six Sigma?
The c-chart is an attribute control chart used to monitor the total number of defects in each inspection unit when the sample size is constant across all subgroups. Six Sigma Study Guide defines it as “the control chart for defects, used to monitor the number of defects in constant size units.” It tracks total defects per unit over time and flags statistical signals that indicate the process may have changed.
What is the formula for the c-chart UCL and LCL?
The centerline (c-bar) is the total number of defects across all subgroups divided by the number of subgroups. The Upper Control Limit (UCL) equals c-bar plus 3 times the square root of c-bar. The Lower Control Limit (LCL) equals c-bar minus 3 times the square root of c-bar. If the calculated LCL is negative, set it to zero because defect counts cannot be negative.
What distribution does the c-chart use?
The c-chart uses the Poisson distribution. The Poisson distribution applies when defects occur randomly and independently, the probability of a defect is constant across the inspection unit, and the sample size is constant. Under the Poisson distribution, the standard deviation equals the square root of the mean. This is why the UCL and LCL formulas use the square root of c-bar.
What is the difference between a c-chart and a u-chart?
Both charts count defects and use the Poisson distribution. The difference is sample size. The c-chart requires a constant sample size — every subgroup must cover the same number of inspection units. The u-chart is used when sample size varies from subgroup to subgroup. If you inspect five boards every shift, use a c-chart. If you inspect however many boards are produced each day, use a u-chart.
What is the difference between a c-chart and a p-chart?
The c-chart counts total defects. One inspection unit can contribute multiple defects. The p-chart counts the proportion of defective units. Each unit is either pass or fail regardless of how many defects it has. Use the c-chart when a single unit can have multiple nonconformances that you want to count individually. Use the p-chart when you classify units as simply defective or not.
When does a c-chart appear in DMAIC?
The c-chart appears in the Measure and Control phases of DMAIC. In the Measure phase, it confirms whether the process is in statistical control before capability analysis begins. A process showing special cause variation must have those causes identified and removed before a baseline is meaningful. In the Control phase, the c-chart monitors the improved process over time to detect any return to the previous defect level.
What are the out-of-control signals for a c-chart?
There are five main out-of-control signals: a single point above the UCL or below the LCL, seven or more consecutive points on the same side of the centerline (indicating a shift), seven or more consecutive points trending in one direction (indicating drift), cyclical patterns of highs and lows (indicating systematic causes), and hugging (points too close to the centerline or limits, suggesting data issues). Points below the LCL should also be investigated — they may signal a genuine improvement or a recording error.
How SSDSI Teaches Attribute Control Charts
At Six Sigma Development Solutions Inc., we cover the c-chart, u-chart, p-chart, and np-chart in both our Green Belt and Black Belt programs.
Students learn the four-chart selection framework, all formulas, how to construct each chart by hand, and how to run them in Minitab. They learn all five out-of-control signals and how to investigate each one.
We deliver training in three formats. Onsite training brings instructors to your facility. Live virtual training delivers the same instructor-led content in real time online. Online self-paced training lets you work through the content on your own schedule.
Every format prepares you for the IASSC Green Belt or Black Belt certification exam. SSDSI is an IASSC Accredited Training Organization.
Ready to master control charts and the full Control phase toolkit?
Explore SSDSI’s Green Belt and Black Belt programs in onsite, live virtual, or online formats.
About Six Sigma Development Solutions, Inc.
Six Sigma Development Solutions, Inc. offers onsite, public, and virtual Lean Six Sigma certification training. We are an Accredited Training Organization by the IASSC (International Association of Six Sigma Certification). We offer Lean Six Sigma Green Belt, Black Belt, and Yellow Belt, as well as LEAN certifications.
Book a Call and Let us know how we can help meet your training needs.


