

Value Stream Mapping documents, analyzes, and improves the steps involved in delivering a product or service. It helps visualize the flow of materials and information from the beginning of a process to the end, where the customer receives the final output.
The goal is simple: identify which steps add value and which ones do not. Once the team sees the entire process laid out visually, they can pinpoint delays, waste, and inefficiencies, then design a better version of the process.
A common phrase used in VSM is:
“Strap yourself to the product and see where you go.”
This means observing each step the product (or service) experiences, from request to delivery, and tracking everything that happens along the way.
Table of contents
What is Value Stream Mapping?
Value Stream Mapping (VSM) visually analyzes and improves the flow of materials and information through a process. It helps organizations see how work moves from start to finish, highlights delays, and identifies waste. VSM maps the entire process from the customer’s request to the final delivery, providing a clear picture of where improvements can be made.
Think of VSM as a specialized flowchart. Instead of just showing steps in a process, it uses specific symbols and colors to reveal the duration of each task, the involved resources, and the bottlenecks within the process. This makes VSM a powerful tool for organizations aiming to deliver better products or services with less waste and more efficiency.
Video: Value Stream Map
What Does a Value Stream Map Show?
A VSM isn’t just a flowchart—it’s a data-rich diagram that gives a complete picture of a process. It typically includes:
- Processing time: How long each step takes
- Wait time: Delays between steps
- Cycle time: Total time from start to finish
- Quality metrics: Such as number of errors or rejects
- Inventory levels: Items waiting between steps
- Resources used: Number of people, tools, and machines
- Space used: Physical area needed for the task
- Distance traveled: For both people and materials
- Other relevant data: Whatever else helps you analyze performance
With this detailed information, teams can clearly see how well their process works—and where it doesn’t.
Purpose of Value Stream Mapping
The main purpose of VSM is to maximize customer value while minimizing waste. It allows teams to evaluate how much of their work actually adds value from the customer’s perspective and how much is just unnecessary effort, delay, or redundancy.
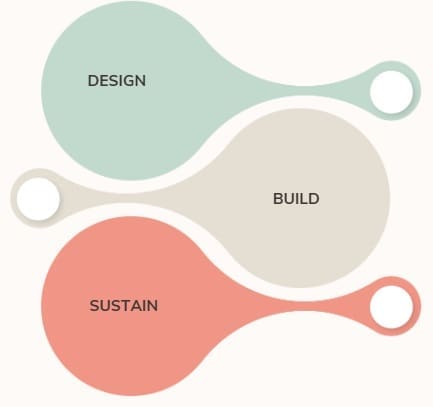
VSM can be used in three key phases:
- Design – From the initial idea to a ready-for-market product.
- Build – From customer order to product delivery.
- Sustain – From customer use to service or end-of-life.
The ultimate goal is to streamline every part of a value-creating process, whether it’s manufacturing, healthcare, software development, or customer service.
How VSM Supports Lean Thinking?
VSM is a core tool in Lean methodology, which focuses on maximizing value and eliminating waste. In Lean, every activity in a process is classified into three categories:
- Value-Added Activities
These directly contribute to what the customer wants. - Non-Value-Added but Necessary Activities
These don’t add value but are required (e.g., inspections or regulations). - Waste
These are unnecessary and should be eliminated (e.g., waiting time, overproduction).
VSM helps categorize tasks so teams can remove waste and improve flow.
Why Organizations Use Value Stream Mapping?
Many organizations that adopt lean methods realize that running isolated improvement events isn’t enough. These events may improve a specific area, but without a bigger plan, the overall system may still underperform.
VSM helps by:
- Providing a shared vision for improvement.
- Connecting small improvements to a larger strategic goal.
- Allowing teams to see waste clearly and design steps to remove it.
- Offering a standardized method for evaluating performance over time.
What is “Value” in Value Stream Mapping?
In lean thinking, “value” means something that the customer is willing to pay for. It must be:
- High in quality
- Delivered at the right time
- Offered at a fair price
Everything else—delays, defects, extra movement, overproduction—is considered waste. VSM helps separate valuable work from non-value-adding activities.
Key Elements of a Value Stream Map
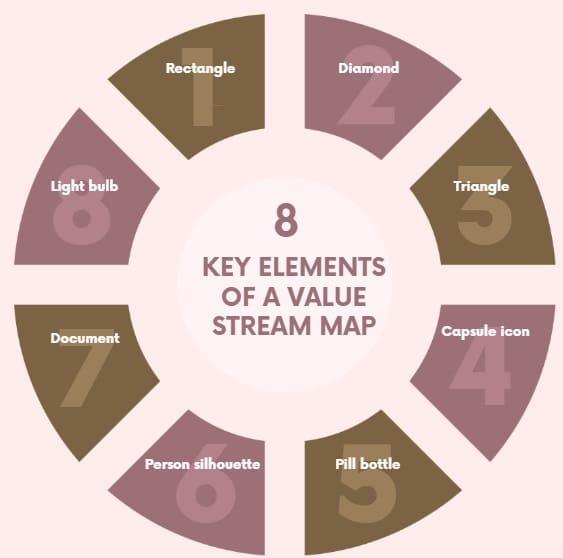
A value stream map uses symbols to represent each part of a process. These symbols are often referred to as the “language of lean.” They help to visualize steps, decisions, and flows of information or materials. Here are the most common symbols and what they mean:
- Rectangle: A specific step or task in the process.
- Diamond: A decision point, where more than one path is possible.
- Triangle: Indicates a product or item.
- Capsule icon: A prescription (in healthcare settings).
- Pill bottle: Signifies a medication issue or drug therapy problem.
- Person silhouette: Represents a patient or customer interaction.
- Document: Documentation or paperwork.
- Light bulb: An area identified for improvement.
Colors are also used:
- Blue: The task has started.
- Yellow: The task is in progress.
- Green: The task is completed.
Example of VSM in a Pharmacy
Let’s walk through a common example: refilling a prescription at a pharmacy.
- Patient Arrives
The process starts when a patient walks in and provides their prescription number. A triangle (indicating a product) represents this, and blue coloring shows that the process has started. - Order Entry
The technician enters the prescription into the system and prints a label. A rectangle shows this action. The triangle and yellow color indicate the process is ongoing. - Filling the Prescription
A fill technician gets the medication, counts the pills using a machine, and attaches the label. These are all steps shown with rectangles. - Checking for Errors
A diamond symbol indicates a decision: was the prescription filled correctly? If not, the process loops back to re-entry. - Pharmacist Review
If everything is correct, the pharmacist reviews the medication for safety, effectiveness, and accuracy. This is shown as another rectangle. - Checkout Process
A staff member bags the medication and completes the transaction. A green triangle shows that the product task is finished. - Patient Questions
If the patient has questions (another decision point), the system calls in the pharmacist (rectangle), and they interact (person symbol). If no questions, the patient departs, and the green triangle indicates completion.
This value stream map helps the pharmacy identify the locations of delays or confusion and what improvements can serve patients faster and more accurately.
How VSM Helps in Healthcare and Other Industries?
Healthcare organizations use VSM to streamline patient care, reduce waiting times, and ensure better communication among departments. Common uses include:
- Improving prescription processes
- Streamlining patient check-in and discharge
- Reducing delays in lab testing
- Enhancing documentation and communication
But VSM isn’t limited to healthcare. Industries like manufacturing, logistics, software, education, and service sectors also benefit from mapping their value streams.
Using VSM in Software Development
In software development, value stream mapping shows the flow from idea to product release. It highlights where delays happen—whether in coding, testing, or deployment.
It answers questions like:
- How much time are we spending on tasks that don’t add value?
- Where do bottlenecks occur?
- Are there unnecessary approvals or handoffs?
Software teams can then reduce handoffs, automate repetitive tasks, and focus on delivering code that directly serves users.
How to Create a Value Stream Map?
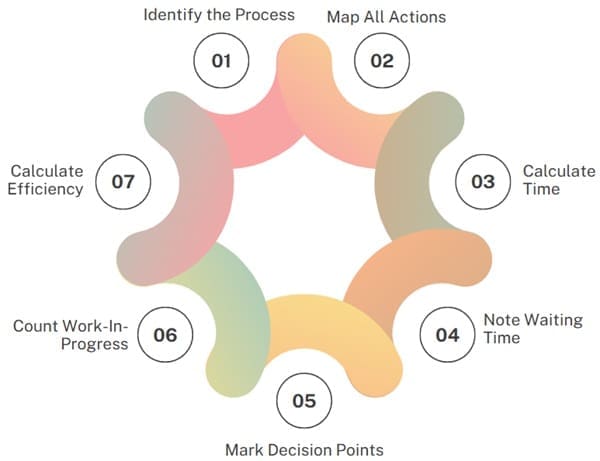
Creating a value stream map involves several steps. Here’s a simple process you can follow:
Step 1: Identify the Process
Start by choosing a process that needs improvement. Define the start and end points. It could be from order entry to delivery or from patient arrival to treatment.
Step 2: Map All Actions
List every step involved in the process. Don’t skip any. Include manual tasks, approvals, wait times, or loops.
Step 3: Calculate Time
Record how much time each step takes. There are two types of time to track:
- Lead time: Total time from start to finish.
- Process time: Actual time spent doing the task.
Step 4: Note Waiting Time
Identify delays between steps. These are often where waste hides. You may find people waiting on approvals, machines, or missing information.
Step 5: Mark Decision Points
Use diamonds to show where choices are made. These often introduce complexity and potential rework.
Step 6: Count Work-In-Progress
Record how many items are in line before each task starts. Too many may signal a bottleneck.
Step 7: Calculate Efficiency
Find out how much of the total time is value-added. This is your process cycle efficiency.
Interpreting the Map
Once your value stream map is ready, it’s time to analyze it. Ask these questions:
- Which steps take the longest?
- Where is the most waiting time?
- Which tasks are repeated or unnecessary?
- Are handoffs slowing things down?
- Is information getting lost?
This analysis allows you to identify waste, improve flow, and design a future-state map with fewer delays and better coordination.
Common Types of Waste VSM Reveals
Value stream mapping helps identify the “7 Wastes” in Lean:
- Overproduction – Making too much or too early.
- Waiting – Delays in getting the next step started.
- Transport – Unnecessary movement of materials or people.
- Overprocessing – Doing more than what’s needed.
- Inventory – Excess supplies or work piling up.
- Motion – Wasted movement (e.g., walking back and forth).
- Defects – Errors that need fixing or rework.
Benefits of Using Value Stream Mapping
Using VSM has many advantages:
- Better understanding of how work flows
- Easier identification of waste
- More alignment among team members
- Increased efficiency and reduced costs
- Improved customer satisfaction
- Clear visual communication of processes
It’s a simple yet highly effective method to promote continuous improvement.
Tips for Effective Value Stream Mapping
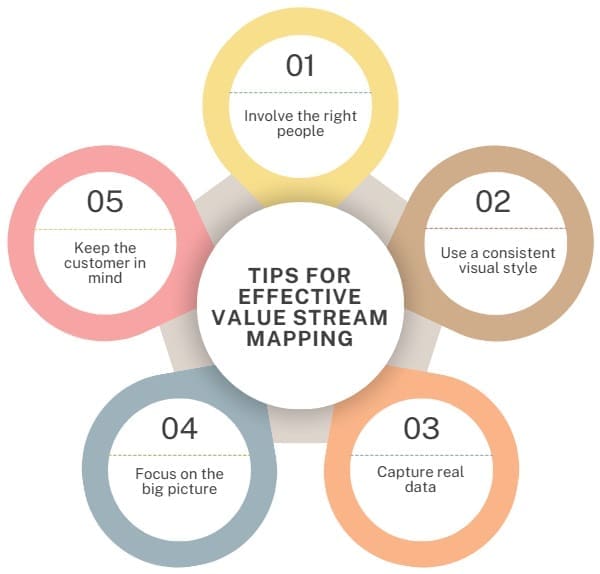
Here are some best practices to make your VSM efforts successful:
- Involve the right people: Include team members from all parts of the process—sales, operations, logistics, IT, etc.
- Use a consistent visual style: Standard icons and symbols help everyone understand the map.
- Capture real data: Don’t rely on guesses or averages—observe the process and measure time, inventory, and quality.
- Focus on the big picture: Don’t get lost in minor details. Look at the flow from start to finish.
- Keep the customer in mind: Every change should improve value delivery to the customer.
Where Can You Use VSM?
VSM can be applied in a wide range of industries and situations:
- Manufacturing: Streamlining production lines and reducing excess inventory.
- Healthcare: Improving patient care, reducing wait times, and coordinating departments.
- Pharmaceuticals: Optimizing prescription refill processes.
- Software Development: Tracking ideas from conception to deployment.
- Logistics and Supply Chain: Improving material handling and reducing transport delays.
- Customer Service: Streamlining ticket resolution and improving communication.
Final Thoughts
Value Stream Mapping is not just about drawing charts—it’s about transforming the way organizations think and work. By using a structured approach to evaluate each step in a process, VSM helps teams see beyond the surface and find real opportunities for improvement.
Whether in a pharmacy, a factory, a hospital, or a software team, VSM provides a roadmap for better performance, greater efficiency, and higher customer satisfaction. By understanding what adds value and what doesn’t, organizations can continuously evolve and deliver more with less.

About Six Sigma Development Solutions, Inc.
Six Sigma Development Solutions, Inc. offers onsite, public, and virtual Lean Six Sigma certification training. We are an Accredited Training Organization by the IASSC (International Association of Six Sigma Certification). We offer Lean Six Sigma Green Belt, Black Belt, and Yellow Belt, as well as LEAN certifications.
Book a Call and Let us know how we can help meet your training needs.


Explained very well!
Thank you Sir.
Kevin, thanks for sharing such invaluable insights.
You are welcome!
Well presented.
Charlie, Thank You.
VSM explained in a very simple way. Thanks
Very well explained!
Thank you Kevin, I realy love you for sharing this information.
Great lesson here! Thanks for providing it. Now a must-keep reference for how to do a value stream map.
Very clear. Thanks for sharing.
Really useful. Thank you.
Finally a website that actually explains how these things work. I’ve been searching for so long.
Thank you Kevin. You Explained the VSM very well.
Very well explained. Thank you 🙂
Anybody pl reply 30 units a day 2 shifts of 420 mins 1st operation cycle time 80 mins with 5 operator and 2nd operatiom with cycle time 24 mins 2 ooerator what will be takt time, production lead time .value adfed time
Sreekanth, Thank you for your comment. The TAKT time = Operating Time per Shift / Demand per Shift. Your TAKT time = Operating Time per Shift (420 minutes)/ Demand per Shift (30) = 14 Minutes per piece. Your Process Cycle Time should average 14 minutes per piece to meet demand. As far as Value Added Time, we can’t determine with the information that is given. This is what the VSM data is for. I hope this helps.
how can i get the application software to build this VSM?
How do you calculate Takt Time for a service process?
I am an insurance broker. I have to do monthly insurance policy renewals for example. The takt time would be available time in the month / the number of policies to renew that month?
Attentive to your prompt response. Thank in advance.
Henry, Great Question … TAKT time (or your case it is called PITCH) could be the available time in the month / the number of policies to renew that month. You could break down to individual steps in policy renewal. This would help you to manage the pace to a more granular level.
good and easy to follow
Excellent explanation of the process. Not to be pointed, I was confused on one point. Shouldn’t the Green posty note represent Customer Value-Added steps? The article shows: •Green post-it notes = Non Value Added (or CVA) activities.