
In the dynamic world of quality management, Six Sigma stands as a beacon of precision, guiding organizations toward operational excellence. At the heart of this methodology lies the control chart—a powerful tool that monitors process stability and performance.
But how do you integrate control charts with other Six Sigma tools and techniques to maximize their impact? This article dives deep into the synergy between control charts and Six Sigma, offering actionable insights to elevate your process improvement journey.
Table of contents
Understanding Control Charts in Six Sigma
Control charts, pioneered by Walter Shewhart, are graphical tools that track process performance over time. They help identify variations—common cause (natural) or special cause (unexpected)—enabling teams to maintain process stability. In Six Sigma, control charts are integral to the Control phase of the DMAIC (Define, Measure, Analyze, Improve, Control) framework, ensuring improvements are sustained.
However, control charts don’t operate in isolation. Their true power emerges when integrated with other Six Sigma tools like process maps, Pareto charts, and statistical process control (SPC). By combining these tools, organizations can achieve a holistic approach to quality improvement, reducing defects and boosting efficiency.
Why Integrate Control Charts with Other Six Sigma Tools?
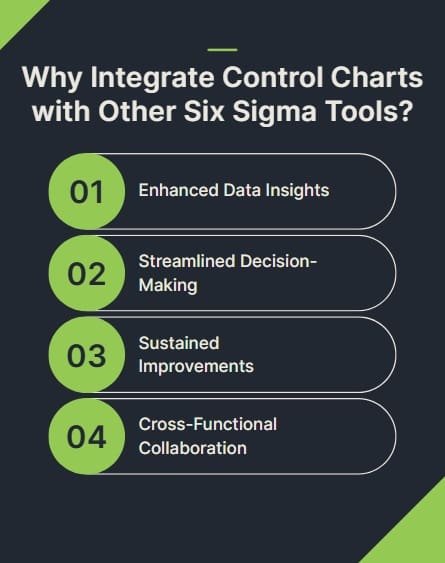
Integrating control charts with other Six Sigma methodologies creates a robust system for process optimization. Here’s why:
- Enhanced Data Insights: Control charts provide real-time data on process stability, which, when paired with tools like histograms or cause-and-effect diagrams, uncovers root causes of variation.
- Streamlined Decision-Making: Combining control charts with tools like FMEA (Failure Modes and Effects Analysis) helps prioritize risks and focus improvement efforts.
- Sustained Improvements: Tools like 5S and standard work ensure processes remain consistent, while control charts monitor ongoing performance.
- Cross-Functional Collaboration: Integration fosters teamwork, as tools like process maps and control charts align teams around shared goals.
Let’s explore how control charts integrate with key Six Sigma tools across the DMAIC phases.

Public, Onsite, Virtual, and Online Six Sigma Certification Training!
- We are accredited by the IASSC.
- Live Public Training at 52 Sites.
- Live Virtual Training.
- Onsite Training (at your organization).
- Interactive Online (self-paced) training,
Integration Across DMAIC Phases
Define Phase: Laying the Foundation
In the Define phase, the goal is to clarify project objectives and scope. Control charts don’t play a direct role here, but they set the stage for later phases. Tools like project charters, SIPOC diagrams (Suppliers, Inputs, Process, Outputs, Customers), and voice of the customer (VOC) analysis help define critical-to-quality (CTQ) metrics. These metrics guide the creation of control charts in subsequent phases.
For example, a manufacturing team aiming to reduce defects in a production line might use a SIPOC diagram to map the process. The CTQ metrics identified—such as defect rates or cycle times—become the variables monitored by control charts later.
Transition Tip: By aligning CTQs with control chart variables, you ensure data collection is purposeful and relevant.
Measure Phase: Building the Data Backbone
The Measure phase focuses on collecting data to establish a baseline. Control charts shine here, as they visualize process performance and variability. However, they work best when paired with tools like:
- Process Maps: These diagrams detail process steps, helping identify where to collect data for control charts. For instance, mapping a call center process might reveal bottlenecks, which control charts can then monitor for cycle time variations.
- Histograms: These display data distribution, complementing control charts by showing whether data is normally distributed—a key assumption for many control chart types.
- Gauge R&R (Repeatability and Reproducibility): This tool ensures measurement systems are reliable, providing accurate data for control charts.
Example: A hospital aiming to reduce patient wait times might use a process map to identify key stages in patient flow. Control charts (e.g., an X-bar and R chart) then track average wait times and variability, while histograms confirm data normality.
Transition Tip: Use process maps and histograms to ensure the data feeding into control charts is accurate and representative.
Analyze Phase: Uncovering Root Causes
In the Analyze phase, teams dig into the root causes of process issues. Control charts identify special cause variations, but other tools provide deeper insights:
- Pareto Charts: These prioritize defects by frequency, helping teams focus on the most impactful issues flagged by control charts. For instance, if a control chart shows out-of-control points in a production process, a Pareto chart can pinpoint the top defect types.
- Cause-and-Effect Diagrams (Fishbone): These identify potential causes of variations seen in control charts, such as equipment failures or operator errors.
- Regression Analysis: This tool explores relationships between variables, helping explain why control charts show instability. For example, regression might reveal that temperature affects product quality in a manufacturing process.
Example: A software company notices spikes in bug reports via a control chart. A fishbone diagram reveals coding errors as a primary cause, while a Pareto chart highlights the most frequent bug types, guiding targeted improvements.
Transition Tip: Pair control charts with Pareto charts and fishbone diagrams to transform raw data into actionable insights.
Improve Phase: Implementing Solutions
The Improve phase focuses on testing and implementing solutions. Control charts monitor the impact of changes, ensuring improvements reduce variability. Key tools include:
- Design of Experiments (DOE): DOE tests multiple variables to optimize processes. Control charts track the results, confirming whether changes stabilize performance.
- Kaizen Events: These rapid improvement workshops address issues identified by control charts, such as reducing cycle time in a production line.
- Poka-Yoke (Mistake-Proofing): This technique prevents errors, and control charts verify its effectiveness by showing reduced special cause variations.
Example: A logistics company implements a new routing system to reduce delivery delays. Control charts track delivery times before and after the change, while DOE tests variables like driver schedules and vehicle types to optimize outcomes.
Transition Tip: Use control charts to validate improvements, ensuring solutions deliver measurable results.
Control Phase: Sustaining Success
The Control phase ensures improvements stick. Control charts are central here, monitoring ongoing process performance. They integrate seamlessly with:
- Standard Work: Documented procedures ensure consistency, while control charts verify adherence by tracking key metrics.
- 5S (Sort, Set in Order, Shine, Standardize, Sustain): This organizes workspaces, reducing variability that control charts might detect.
- FMEA: By identifying potential failure modes, FMEA helps teams proactively address risks, ensuring control charts show stable processes.
Example: A retail chain standardizes checkout procedures using 5S and standard work. Control charts monitor transaction times, alerting managers to deviations that might indicate training gaps.
Transition Tip: Combine control charts with standard work and 5S to lock in gains and maintain process stability.
Advanced Integration Techniques
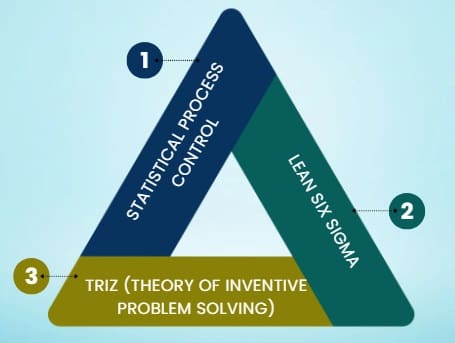
Beyond DMAIC, control charts integrate with advanced Six Sigma methodologies:
- Statistical Process Control (SPC): Control charts are a core component of SPC, which uses statistical methods to monitor and control processes. SPC tools like capability analysis (Cp and Cpk) assess whether processes meet specifications, complementing control chart insights.
- Lean Six Sigma: Lean tools like value stream mapping (VSM) identify waste, while control charts monitor process efficiency post-improvement. For example, VSM might streamline a production process, and control charts ensure cycle times remain stable.
- TRIZ (Theory of Inventive Problem Solving): This problem-solving methodology generates innovative solutions, which control charts validate by tracking performance metrics.
Example: A pharmaceutical company uses VSM to reduce packaging waste, then monitors defect rates with control charts to ensure quality remains high.
Also Read: I-MR Chart: Mastering Individual Moving Range Control Charts
Practical Tips for Effective Integration
- Choose the Right Control Chart: Select the appropriate chart (e.g., X-bar and R, p-chart, c-chart) based on data type and process characteristics.
- Align Metrics with Goals: Ensure control chart variables align with CTQs defined in the Define phase.
- Train Teams: Educate staff on interpreting control charts and using complementary tools like Pareto charts or DOE.
- Automate Data Collection: Use software like Minitab or JMP to streamline control chart creation and analysis.
- Review Regularly: Schedule periodic reviews of control charts and other tools to catch issues early.
Challenges and Solutions
Integrating control charts with Six Sigma tools isn’t without challenges:
- Challenge: Data overload from multiple tools. Solution: Use dashboards to consolidate insights from control charts, Pareto charts, and histograms.
- Challenge: Resistance to change from teams. Solution: Conduct training and demonstrate tangible benefits, like reduced defects or faster processes.
- Challenge: Misinterpreting control chart signals. Solution: Pair control charts with root cause analysis tools to validate findings.
FAQs on Integrate Control Charts with Six Sigma Tools
What are control charts in Six Sigma?
Control charts are graphical tools that monitor process stability over time, identifying variations and ensuring consistent performance in Six Sigma projects.
How do control charts integrate with DMAIC?
Control charts are used primarily in the Measure and Control phases but support all DMAIC phases when paired with tools like process maps, Pareto charts, and FMEA.
Which Six Sigma tools work best with control charts?
Tools like process maps, histograms, Pareto charts, cause-and-effect diagrams, DOE, and 5S complement control charts, enhancing data analysis and process control.
Can control charts be used in Lean Six Sigma?
Yes, control charts integrate with Lean tools like value stream mapping to monitor process efficiency and reduce waste while maintaining quality.
How do I choose the right control chart?
Select a control chart based on data type (continuous or discrete) and process characteristics. Common types include X-bar and R, p-charts, and c-charts.
Final Words
Integrating control charts with other Six Sigma tools transforms them from standalone monitors into pillars of a comprehensive quality management system. By aligning control charts with DMAIC phases and tools like process maps, Pareto charts, and DOE, organizations can uncover root causes, implement effective solutions, and sustain improvements. Whether you’re streamlining manufacturing, optimizing healthcare, or enhancing customer service, this synergy drives measurable results.

About Six Sigma Development Solutions, Inc.
Six Sigma Development Solutions, Inc. offers onsite, public, and virtual Lean Six Sigma certification training. We are an Accredited Training Organization by the IASSC (International Association of Six Sigma Certification). We offer Lean Six Sigma Green Belt, Black Belt, and Yellow Belt, as well as LEAN certifications.
Book a Call and Let us know how we can help meet your training needs.


