
Your process has been running for weeks. The output looks reasonable. But a customer audit is coming, and they want to see your Cpk.
Do you know what it is? More importantly, do you know what it means?
Cpk — the Process Capability Index — is one of the most commonly requested metrics in manufacturing and quality management. It answers a question that matters to every customer, supplier, and quality engineer: can this process reliably produce output within specification, not just some of the time, but consistently?
This guide covers exactly what Cpk measures, how to calculate it, how to read the number, how it differs from Cp and Ppk, and what to do when it is not where it needs to be.
Table of contents
What Cpk Measures?
Cpk measures how well a process performs relative to its specification limits, accounting for both variation and centering.
That last part — “accounting for centering” — is what makes Cpk more useful than its close relative, Cp. A process can have plenty of room within the specification range and still produce defects if the average output is sitting too close to one of the limits. Cpk catches that. Cp does not.
Think of it this way. Cp asks: is the process spread narrow enough to fit within the spec range? Cpk asks: is the process spread narrow enough, and is it positioned correctly within that range?
You need both to be true for a process to reliably produce conforming output.

Public, Onsite, Virtual, and Online Six Sigma Certification Training!
- We are accredited by the IASSC.
- Live Public Training at 52 Sites.
- Live Virtual Training.
- Onsite Training (at your organization).
- Interactive Online (self-paced) training,
The Cpk Formula
Cpk is calculated by taking the minimum of two values — one for each specification limit:
Cpk = min [ (USL − μ) ÷ 3σ , (μ − LSL) ÷ 3σ ]
Where:
- USL = Upper Specification Limit (set by the customer or design requirement)
- LSL = Lower Specification Limit
- μ (mu) = the process mean (average of your data)
- σ (sigma) = the process standard deviation (within-subgroup, for short-term Cpk)
You calculate both ratios and take the smaller one. This is intentional. Cpk always reports the worst side — the side where the process mean sits closest to a specification limit, where the defect risk is highest.
A worked example:
A team is measuring shaft diameters. Specifications require a diameter between 49.5mm (LSL) and 50.5mm (USL). Their process data shows:
- Mean (μ) = 50.2mm
- Standard deviation (σ) = 0.1mm
Upper side: (50.5 − 50.2) ÷ (3 × 0.1) = 0.3 ÷ 0.3 = 1.00
Lower side: (50.2 − 49.5) ÷ (3 × 0.1) = 0.7 ÷ 0.3 = 2.33
Cpk = minimum of 1.00 and 2.33 = 1.00
The process mean has drifted toward the upper specification limit. Even though there is plenty of room on the lower side, the Cpk of 1.00 reflects the true risk — the process is only marginally capable at the USL. This is precisely the information a point estimate of “average = 50.2mm” would not have revealed.
Also Read: How do you decide whether to use Six Sigma or Lean for a Process Improvement Project?
How to Interpret Your Cpk Value
Once you have a Cpk number, here is how to read it:
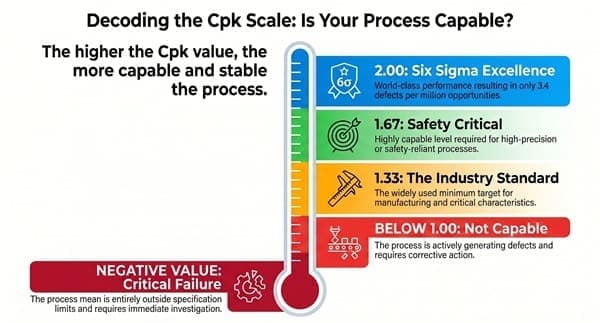
Cpk below 1.00 The process is not capable. It is generating defects. Output is falling outside specification limits, and corrective action is required before this process can be considered acceptable.
Cpk between 1.00 and 1.33 The process is marginally capable. Some industries accept this range for non-critical characteristics, but there is very little margin for natural process drift. A small shift in the mean or an increase in variation will immediately produce out-of-spec output.
Cpk of 1.33 The widely used minimum target in manufacturing environments. This corresponds to roughly 4-sigma performance. At this level, even if the process mean shifts slightly, the process retains a reasonable buffer before producing defects. The Automotive Industry Action Group (AIAG) and many other industry bodies use 1.33 as a standard minimum for critical characteristics.
Cpk of 1.67 Considered highly capable. This target is often required for safety-critical or high-precision processes.
Cpk of 2.00 This is the Six Sigma target. A Cpk of 2.00 corresponds to approximately 6-sigma short-term performance, which — accounting for the expected 1.5-sigma long-term process drift — produces no more than 3.4 defects per million opportunities (DPMO).
When Cpk is negative A negative Cpk means the process mean has moved outside the specification limits entirely. The process is producing output that is, on average, out of spec. This is a serious condition requiring immediate investigation.
Cp vs Cpk: What Is the Difference?
This distinction is one of the most important — and most frequently confused — in process capability analysis.
Cp measures potential capability. It compares the width of the specification range to the natural spread of the process (6σ). It assumes the process is perfectly centered between the spec limits. If your process were centered, could it produce conforming output?
Cpk measures actual capability. It accounts for where the process mean currently sits relative to both limits. It reflects what is really happening, not what could happen under ideal conditions.
The relationship between Cp and Cpk tells you something specific about your process:
When Cp is high but Cpk is significantly lower, the process has enough spread potential but is off-center. The variation is acceptable — the mean just needs to be adjusted toward the midpoint of the specification. This is often a fast fix: recalibrate a tool, adjust a setpoint, correct a setup error.
When Cp and Cpk are close in value, the process is well-centered. If both are low, the problem is excess variation. The spread of the process is too wide for the specification range, and you need to identify and reduce sources of variation.
Cpk can never be higher than Cp. Cp is the ceiling. Cpk is where you actually are.
Cpk vs Ppk: Short-Term vs Long-Term Capability
Cpk and Ppk look similar and their formulas are structurally the same. The difference is in how standard deviation is calculated — and it matters.
Cpk uses within-subgroup standard deviation. It captures short-term, controlled variation — what the process can achieve when operating under stable, consistent conditions. It reflects process capability: what the process is capable of when it is in control.
Ppk uses the overall standard deviation calculated from all individual data points across the full data set. It captures long-term variation, including process shifts, batch-to-batch differences, and the natural drift that happens over time. It reflects process performance: how the process actually behaved across an extended period.
In a stable, well-controlled process, Cpk and Ppk will be close in value. When there is a large gap between them — Cpk is notably higher than Ppk — it signals that special causes of variation exist. The process is not as stable as the short-term data suggested.
When to use which:
Use Cpk when: the process is in statistical control, you are setting a capability baseline for a new or improved process, or a customer requests short-term process capability for approval purposes.
Use Ppk when: you need to report overall process performance over a longer historical period, you are conducting a baseline study before improvement, or the process is not yet confirmed to be in statistical control.
A critical rule: before calculating either index, confirm the process is stable using a control chart. Capability indices calculated on an unstable process produce misleading numbers.
Also Read: Best Lean Manufacturing Process Improvement Certification
Where Cpk Fits in DMAIC
Cpk appears at multiple points across a Six Sigma DMAIC project.
Measure phase: Cpk establishes the baseline. Before any improvement work begins, the team calculates the current Cpk to quantify exactly how incapable the process is. This baseline becomes the reference point for measuring improvement later.
Analyze phase: Comparing Cp and Cpk helps pinpoint the type of problem — off-centering versus excess variation — which guides the direction of root cause analysis.
Improve phase: After changes are implemented, recalculating Cpk confirms whether the improvement is real. A higher Cpk post-improvement, on a stable process, is objective evidence that the project delivered results.
Control phase: Ongoing Cpk monitoring ensures the gains hold over time. Many control plans include Cpk targets that trigger investigation if the index drops below a set threshold.
What to Do When Cpk Is Too Low
A low Cpk is not a mystery — it is a diagnosis. The Cp-to-Cpk comparison tells you exactly which problem you are dealing with.
Scenario 1: Good Cp, Low Cpk (off-center process)
The process variation is acceptable, but the mean has shifted toward one limit. Start by investigating why the process is not centered:
- Equipment drift or wear shifting output in one direction
- Incorrect setup at the start of a shift or batch
- Raw material changes affecting the process mean
- Operator adjustments that have inadvertently moved the average
Centering is often the fastest and least expensive Cpk improvement. In many cases, adjusting a single setpoint or calibrating a tool can close much of the gap between Cp and Cpk.
Scenario 2: Low Cp and Low Cpk (excess variation)
The process spread is too wide for the specification range. Centering will not fix this — you can only shift the defects from one tail to the other. Reducing variation requires identifying its sources:
- Raw material or incoming component inconsistency
- Equipment condition, wear, or calibration issues
- Measurement system error (always check this first with an MSA before concluding the process is the problem)
- Environmental factors: temperature, humidity, vibration
- Operator-to-operator differences in method
A structured DMAIC project is the appropriate response here. Use fishbone diagrams, process maps, and hypothesis testing to isolate the dominant sources of variation, then address them systematically.
Important: Do not attempt to center a process with high variation. Moving the mean only redistributes defects between the two tails. Reduce variation first, then center.
How Many Data Points Do You Need for a Reliable Cpk?
A Cpk calculated from 10 data points is far less reliable than one calculated from 100. The standard recommendation is a minimum of 25 to 30 consecutive data points collected during representative operating conditions — normal materials, normal operators, normal equipment.
For critical-to-quality characteristics or formal customer submissions, many industries require larger datasets and confidence intervals around the Cpk estimate. A Cpk of 1.40 calculated from 30 data points has a confidence interval that could extend down to 1.10 or lower. That matters when 1.33 is your minimum threshold.
If you are working with small samples, report the Cpk alongside its confidence interval — not just the point estimate.
Cpk in Context: What Industry Standards Require
Different industries set their own Cpk minimums for critical characteristics. A few well-established references:
Automotive (AIAG PPAP): The Production Part Approval Process requires a minimum Cpk of 1.67 for critical characteristics during initial process study, with a sustained minimum of 1.33. These thresholds are specified in the AIAG Production Part Approval Process manual, 4th edition.
General manufacturing: Cpk ≥ 1.33 is the most widely used general minimum for capable processes.
Six Sigma target: Cpk = 2.00, corresponding to 3.4 DPMO (with the 1.5-sigma long-term shift assumption).
Medical and pharmaceutical: Regulatory expectations vary, but critical process parameters often require Cpk ≥ 1.33 to 1.67, with documented evidence from process validation studies.
Always confirm the specific requirements with your customer. Industry-wide thresholds are defaults — what a particular customer requires in their contract or quality plan takes precedence.
Learn Cpk and Process Capability in Our Lean Six Sigma Training
Understanding Cpk conceptually is a starting point. Using it confidently in a real project — calculating it correctly, interpreting the Cp vs Cpk relationship, choosing between Cpk and Ppk, and then driving actual improvement — requires structured training and hands-on practice.
At Six Sigma Development Solutions, we teach process capability analysis as a core part of our Green Belt and Black Belt programs. You will work through calculations, read real capability outputs, and apply the tools inside a full DMAIC project structure.
We offer training in three formats to fit your needs:
- Onsite training at your facility, using your processes and your data
- Live virtual classroom with a live instructor, interactive sessions, and structured projects
- Online self-paced certification you can complete on your own schedule
Our Green Belt program covers the full process capability toolkit — Cp, Cpk, Ppk, capability charts, control charts, and measurement system analysis. Our Black Belt program goes deeper into advanced statistical methods and multi-variable analysis.
About Six Sigma Development Solutions, Inc.
Six Sigma Development Solutions, Inc. offers onsite, public, and virtual Lean Six Sigma certification training. We are an Accredited Training Organization by the IASSC (International Association of Six Sigma Certification). We offer Lean Six Sigma Green Belt, Black Belt, and Yellow Belt, as well as LEAN certifications.
Book a Call and Let us know how we can help meet your training needs.


