

Table of contents

What if you could tap into the Mind of a Master Black Belt to help you in your Lean Six Sigma Project?
My Name is Kevin Clay and I am a Master Black Belt with Over 20 Years of Experience. I’ve completed hundreds of Lean and Six Sigma projects with ideas all over the Globe with Multi-Million Dollar Results.
Below are the 10 simple steps that I use to conduct every Lean Six Sigma project. Follow these steps and you will get Amazing Results from your Lean Six Sigma Project Every Time!
- Don’t Try and Solve World Hunger
- Go to Gemba!
- Plan Your Work and THEN Work Your Plan
- Track the Needle
- Verify your Focus
- Be the Ball
- Look for the 6’ View
- Decipher the Code
- Prioritize and Manage
- Mimes make the Best Operators
1. Don’t Try and Solve World Hunger
What can cause a Six Sigma Project to Have a Slow Agonizing Death? Not having a manageable scope!
Only about 35% of Lean Six Sigma Projects are completed (this is a conservative number).
Why? Because no one has educated the belt that it is improbable they will solve world hunger. This eventually leads to a permanently stalled project.
We teach our students that three of the most important words when it comes to Lean Six Sigma Project Scope are: focus, focus, and focus!
You can’t solve world hunger but you have a greater likelihood of success if you focus on one small village.
Once you Improve, Optimize and Control hunger in that small village then we can translate the Improvements to the next village in our priority with subsequent “multi-generational projects”.
With each generation of projects to solve world hunger, each village gets easier. We can even expand our scope to Improve several villages at once as we have encountered most of the variables in previous projects.
I’m guessing the question that is burning in your mind is “do I have to solve world hunger before I complete my project?”
The answer is “No”. Each generation of projects is considered its own project.
The best tool for understanding the optimal Scope of a Project is the Pareto Chart.
To use the Pareto Chart, we must first have data.
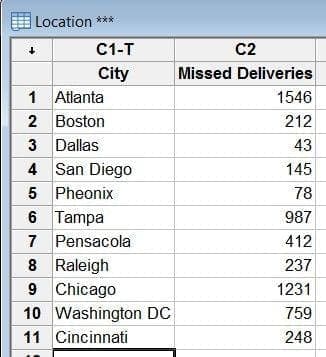
In this scenario, the belt has been given the task to reduce missed deliveries in the domestic U.S.
As Lean Six Sigma practitioners, we know that focusing on the larger problem will decrease our chance of success. We need to scope down to a project that we can manage.
Below is the data:
We need to see the data in a Graphical format, so now we produce the Pareto Chart.
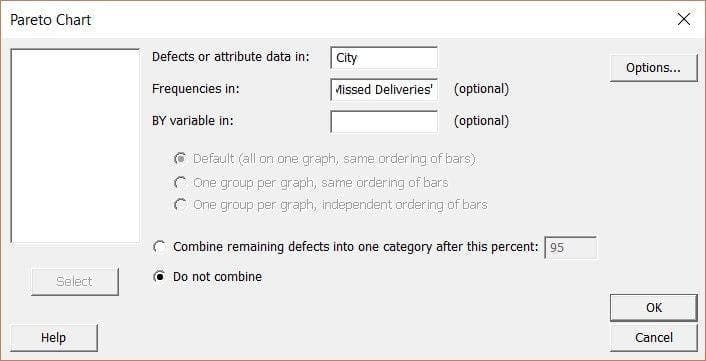
In Minitab 17, the Pareto Chart is found at Stat > Quality Tools > Pareto Chart …
Fill in the Pareto Chart as seen in the picture below:
[et_bloom_locked optin_id=optin_7]
This will produce the following “Pareto Chart of City”:
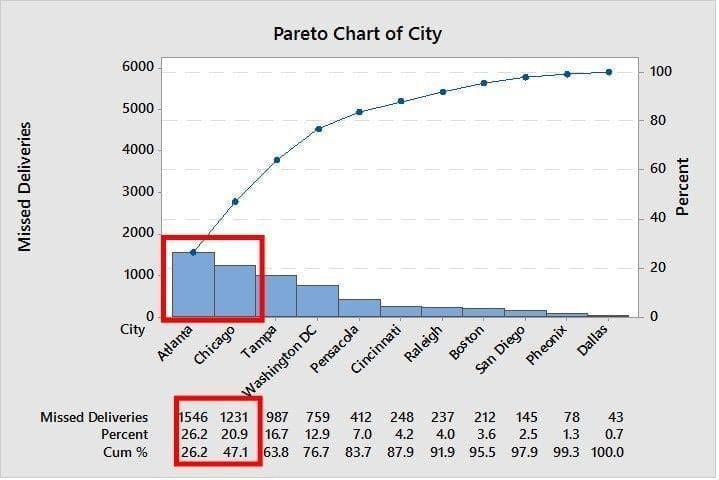
The Pareto Chart shows you that Atlanta and Chicago are where 47.1% of Missed Shipments occur, yet they are only 2 out of the 11 cities.
This chart can help us reduce our scope to one or both cities.
We can then use further Pareto Charts to scope down on Counties or Districts within the Cities.
Remember, Focus, Focus and Focus!
2. Go to Gemba!
The word ‘Gemba” is Japanese for “the real place”. Therefore, Go to Gemba means go to the real place … the place where the problem exists.
Spend time there understanding the process and problem.
It perplexes me to see teams try and solve a problem from a boardroom without spending time at where the problem exists.
When these teams start to map the process, they only capture the 30 thousand foot view. Even the experienced process owners (what we call SME’s or Subject Matter Experts) will miss inputs.
I was leading a SMED project at bottle filling industry, and the team was heavily engaged in mapping the process.
They had experienced SME’s in the team. As I watched the process unfold with colored post-it notes on the boardroom wall, I saw a lot of “holes in the process”.
The team had spent little time at “gemba”. They trusted that the SME’s would provide the detail.
To make a long story short, the team had missed an important input. Operators had no defined standards for set points for the different product.
They each had their own way to record the last best setup on a product. Most kept a small memo pad in their pocket they recorded the last good setup as well as other pertinent information for their daily tasks.
As the team was mapping the process, I decided to “go to gemba” and watch the changeover in its current state (I was lucky enough to have a changeover in process).
This is where I witnessed the memo pad in use.
You are probably asking the question “How long should I stay at gemba”?
We task our teams to get immersed in the process. We ask that each belt spend at least one shift of no less than eight hours at each shift of the process.
For example, if the process spans three shifts, they should spend at least eight hours on each of shift.
What should we look for? Anything input to the process no matter how small or seemingly insignificant (a pen, notepad, set point markings etched on a machine).
Let the tools weed out those that do not have a significant effect.
3. Plan Your Work and THEN Work Your Plan
The charter is one of the first and most important solutions the team will use in their project. The charter is where the team sets the foundation their Project. Without a good foundation, the project will most likely fail.
Most teams new to a Lean Six Sigma project without a proper mentor to help them develop the project charter will not build the proper foundation.
I probably got your attention when I said “with a proper mentor”. Don’t be scared by that statement. I know that most of you may not have experienced Lean Six Sigma Black Belt or Master Black Belt Mentors to help with your project. This is the reason that my colleagues and I write these articles … to be your mentor.
“How do I build the foundation?” you ask.
Let me tell you the four important elements of the Charter and give you some examples of how it is written incorrectly (thereby weakening the foundation).
The “Problem Statement”
The “Problem Statement” is what I call the “Starting Line”. To run a race, you must have a known starting point. This starting point in our project is the process baseline (s).
The Purpose of the Problem Statement is to clearly Define and Quantify (using Metrics) the Current State (problem or opportunity).
I tell my students when creating a Problem Statement, use “SAM”. SAM stand for Specific And Measurable.
An example of a problem statement:
“In the last six months, 20% of our repeat customers paid their invoices over 60 days late. The current rate of late payments is up from 10% in 2015 and represents 30% of outstanding receivables. This affects our operating cash flow by $259k”
Two statements you should never see in Problem Statement in a Project Charter:
- NEVER Assign Blame in a problem statement.
- NEVER State the Solution to the Problem (if you know the solution, there is no need to waste time on a Six Sigma Project).
For example, “Invoices are over 60 days late because of our antiquated ERP system. We need to evaluate upgrading to the newest version”. (ß This is a bad Problem Statement!)
The “Goal (or Objective) Statement”
The “Goal (or Objective) Statement” is what I call the “Finish Line”. To run a race, you must have a known finishing point. This finishing point helps us to understand if we have had the required effect on the process.
The Goal Statement defines the expected improvement the team is seeking to achieve in clear, concise and measurable terms.
A good Goal Statement:
- Is SMART (Specific, Measurable, Attainable, Relevant and Time Bound)
- Does not assign blame, presume cause, or prescribe a solution
- Starts with a verb (reduce, achieve, control, increase)
An example of an effective Goal Statement:
Increase (<-verb) employee motivation survey scores (<-what is improved) from the current 42% to 70% (<-improvement and gap) by end of 3rd. Quarter 2005 (<-completion date) The Business Case I relate the “purpose of the race” to the Business Case on the charter. The Business case is where we start to understand the urgency of the project. The Business Case defines: Why is the project worth doing? Why is it important to do now? What are the consequences of not doing this project? A good Business Case Connects the project to the strategic priorities (KPI’s) of the business.
- How will this project drive business initiatives and goals?
- How will this project impact the customer, internal and external? The Stakeholder?
- What are the expected financial benefits (revenue increase and/or cost reduction)?
A good template to use when developing a Business Case for a Six Sigma Project Charter:
“From time1 to time2, we experience pain metric. With a target of target metric, this gap of ## leads to a Cost of Poor Quality of $$.”
The Scope Statement
To expand on the analogy that we have used thus far when describing the important elements of the charter, the “Route” of the Race is related to the Scope. The scope focuses on the boundaries and of the improvement efforts.
If scope has not clearly been defined, projects are subject to scope creep resulting in projects that stall indefinitely. Scope can include geographies, products and departments, customers and start and stop points of the process.
Improperly scoping projects are, in my experience, the #1 reason for projects failure (refer to #1 in our list “Don’t Try and Solve World Hunger”)
3. Track the Needle
The only way you can quantify the effect on the process that you are trying to improve is by using quantitative data (metrics). If you are not using metrics to prove effect, then you are using your opinion.
I tell my students “No one cares about your opinion”. That may sound crass, but opinions, judgements, “shooting from the hip” can all be incorrect. This can leave you open to a lot of questions by your stakeholders.
Quantitative Data (Metrics) that have been proven reliable with an MSA are relatively bullet proof.
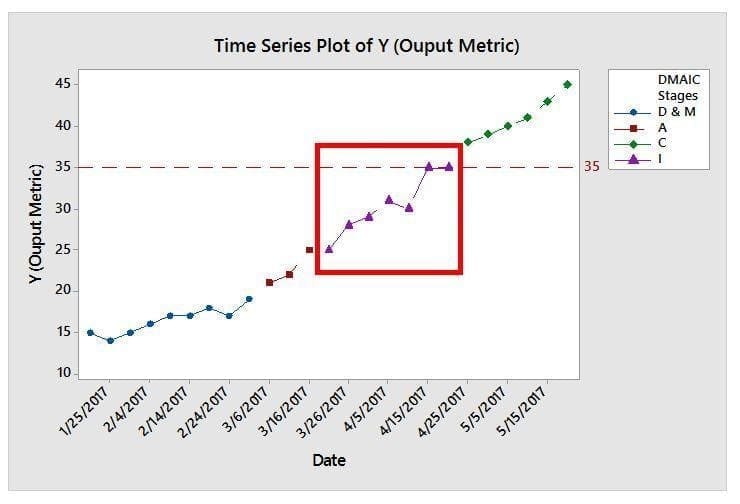
In my experience, the best tool for Tracking changes in the Y is the Time Series Plot.
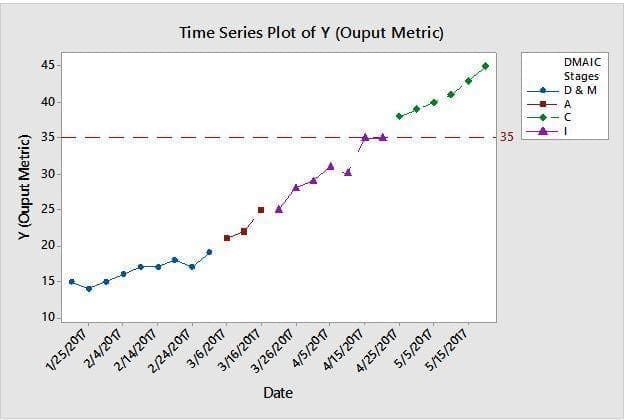
As you make changes to the process during any of the DMAIC stages, there should be a measurable effect. The Time Series chart will plot the effect.
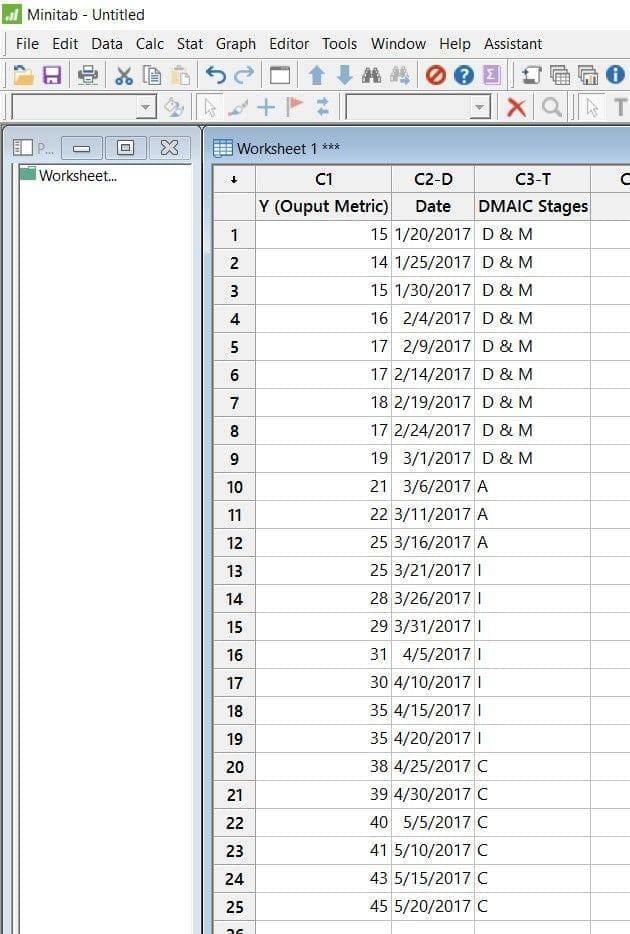
Hint, be sure to use a time scale on your time series plot to show the dates of each improvement (see picture below)
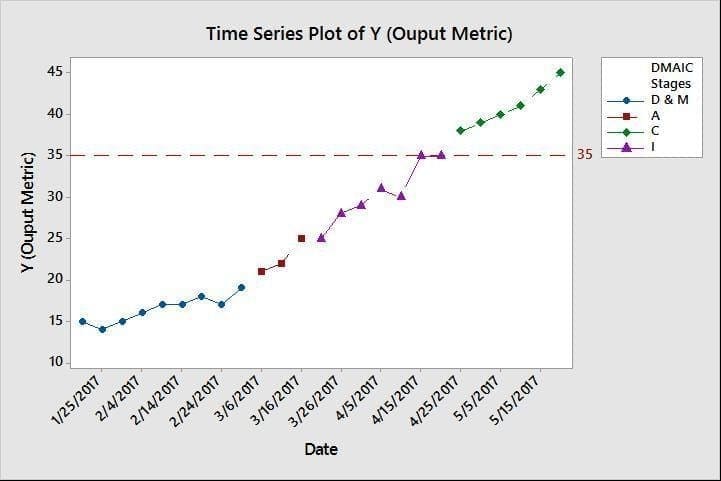
The Time Series Plot is a simple tool for your Stakeholders to show progression of the project over time.
Let’s learn how to create the time series plot in the picture above using Minitab 17
First, we need the data:
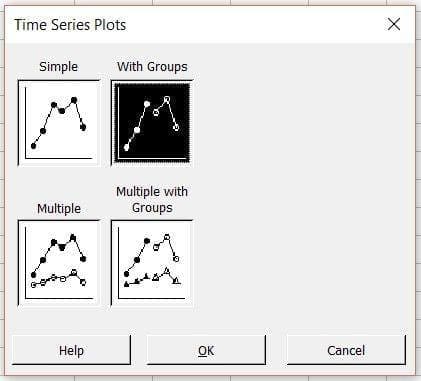
Next, we will open the Time Series Plot:
In the Minitab Menu Bar, go to “Graph” and then click on “Time Series Plot”
In the Time Series Plots dialogue box (see picture below) choose “With Groups”. We do this because we are tracking within the DMAIC Stages.
Next, We fill in the “Time Series Plot With Groups” dialogue box as shown in the picture below.
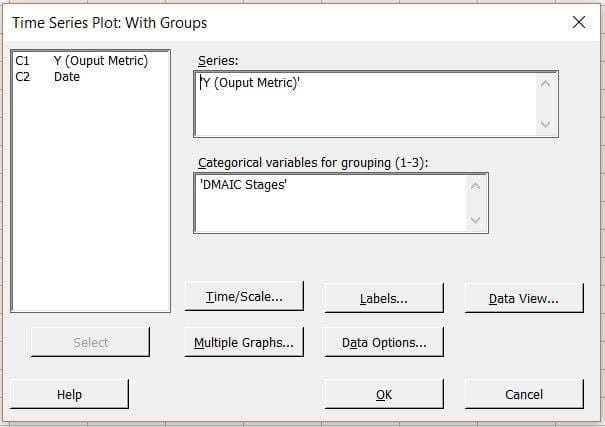
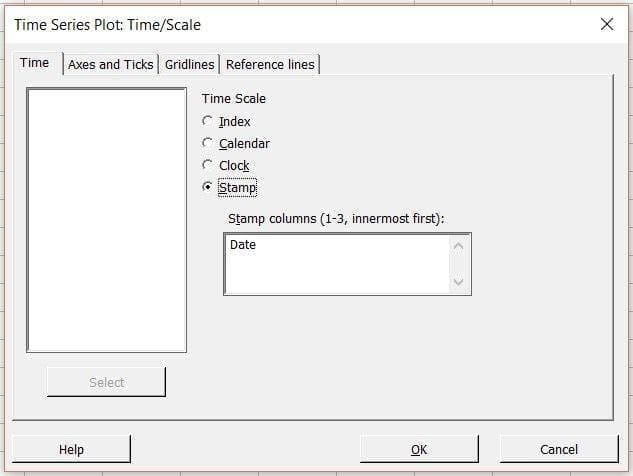
We then click on the “Time/Scale…” button to add the Time Scale that we have defined in our data in the column “Date”
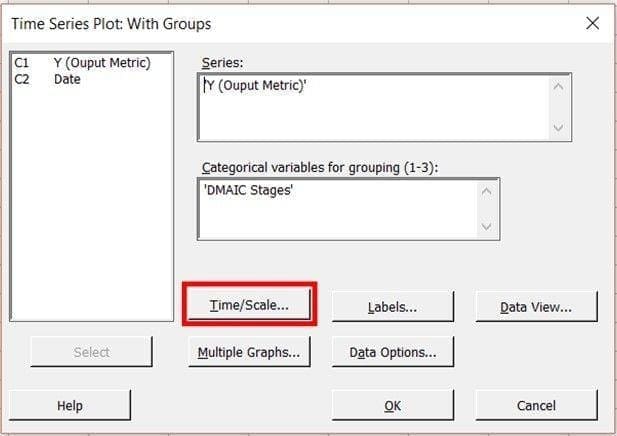
The “Time Series Plot: Time/Scale” Dialogue box will open. Click on “Stamp” and choose the “Date” column.
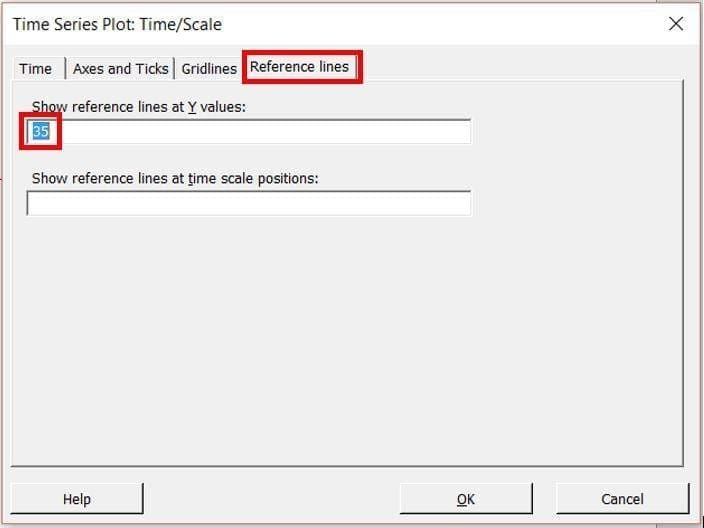
Now click on the “Reference lines” tab. Enter “35” under “Show reference lines at Y values:”. This is the target for your Y value that should be referenced in your “Goal (or Objective) Statement” in your Project Charter.
Click on “OK” and then click on “OK” again and you should produce the following Time Series Plot:
5. Verify your Focus
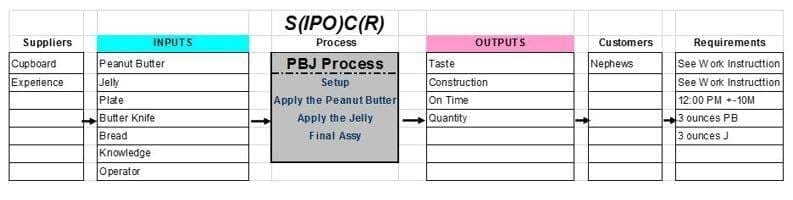
The SIPOC(R) is an Acronym for Supplier Input Process Output Customer Requirement.
The SIPOC Diagram is one of the Most Important tools in a Lean and/or Six Sigma project.
This tool will help the team identify whether they have focused on the right process. The SIPOC(R) will also help the team to understand who their Customers are and what are their Requirements
The SIPOC(R) helps us break down our process into External Inputs and their Suppliers; Process Steps; and Outputs, Customers and their Requirements. This diagram allows us to see the process from the 30,000 foot view.
The Picture below is a basic diagram to understand the SIPOC(R):
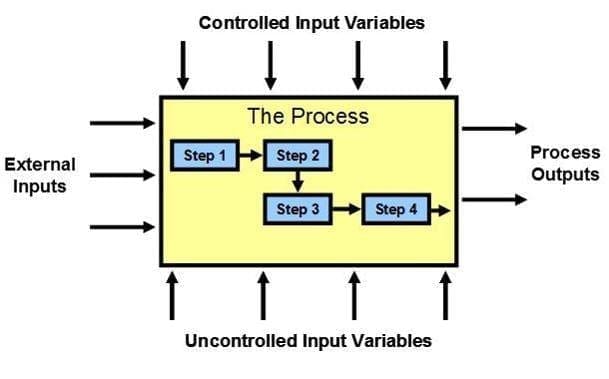
I like to use the example of Mowing a Lawn to describe the Diagram above. The Scope of “The Process” is inside of the box.
The “External Inputs” (left of the box) are those things that are fed to the process in order for the process to work.
Let’s say that the Scope of The Process of Mowing the Lawn starts with: You are standing behind the lawnmower, it is running and ready to mow the lawn. What is fed to The Process in order for the Process to Work?
- Someone (or Something) to push the lawnmower
- A Lawnmower
- Knowledge of how to work the lawnmower
- Proper Weather
Why is it important to understand our External Inputs?
Our focus during the Lean and Six Sigma Project will be on the “P” in the SIPOC. What if we are focused on the wrong process?
By understanding our “External Inputs”, we might find one or more “External Inputs” have a significant effect on our “Process Output”.
By not addressing that Input, we may not make a significant enough improvement to our “Process Output”.
One of the Most Powerful aspects of a SIPOC is to help a project team determine if they have the right focus.
An example of the SIPOC:
6. Be the Ball
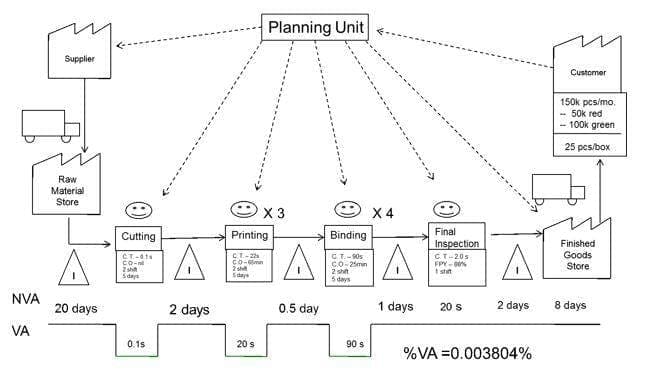
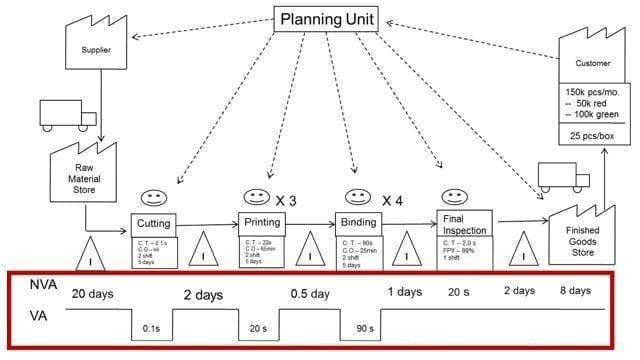
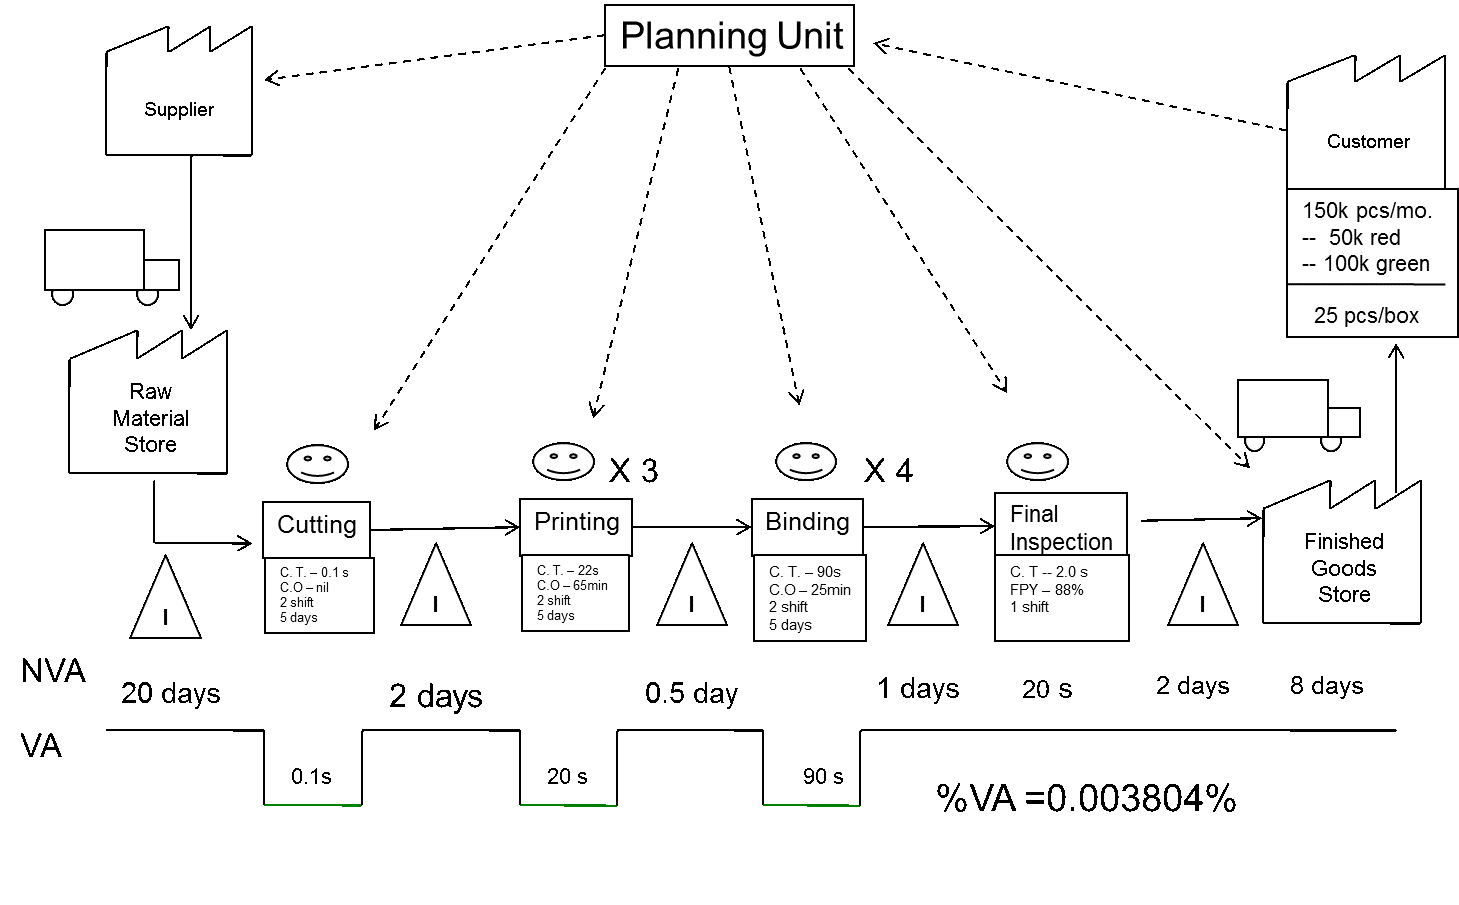
One of the most powerful tools in the Lean Toolbox is the Value Stream Map. In a short time (usually less than an hour) you can effectively communicate where the focus of your Continuous Improvement efforts will have the most effect.
The Value Stream Map is full of pictures and friendly symbols which make a simple tool understand and develop.
Below is an example of a Value Stream Map for a Printing and Binding Operation
Step 1 – Understand Value
The first step to developing a Value Stream Map is to understand the concept of “value-adding activities”. There are three criteria for Value Adding Activities:
- Customer wants you to do it
- The material or information is being processed or transformed to final products
- It is done right the first time
Any activity that exists outside of these three criteria is considered “Waste”.
Once we understand and define value for the organization and we understand the focus, we now start to develop the VSM.
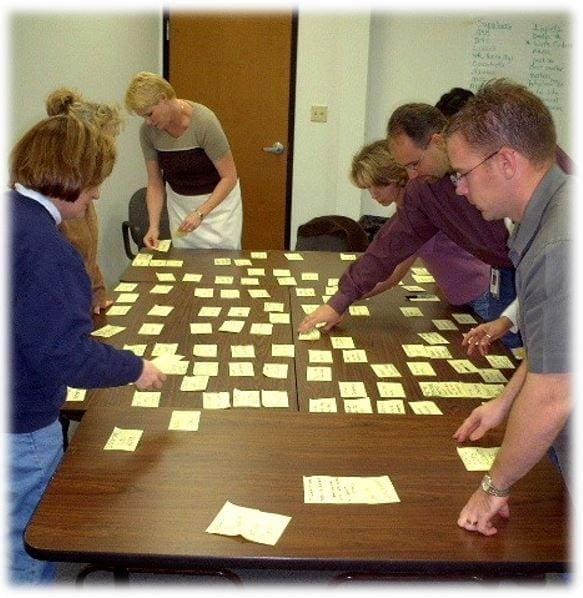
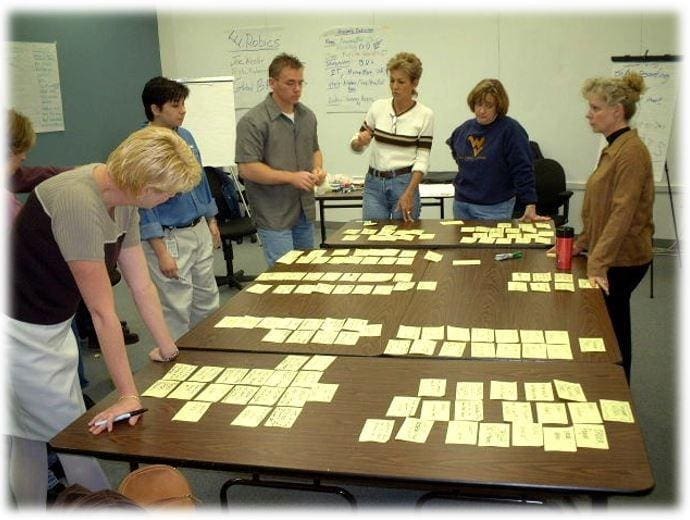
I have worked with hundreds of teams and have found that developing a Value Stream Map manually with Post It notes and flip charts work best.
Step 2 – What is our Focus?
Before we learn how to define our focus, let’s correct a misunderstanding that I see in many teams when developing a Value Stream Map.
A Value Stream Map is not a process flowchart. What I mean by this is that a Value Stream Map does not track all of possible paths that the process can take.
A Value Stream Map tracks one part, service or transaction or a family of parts, services or transactions through the process. We only track one path of “value stream”.
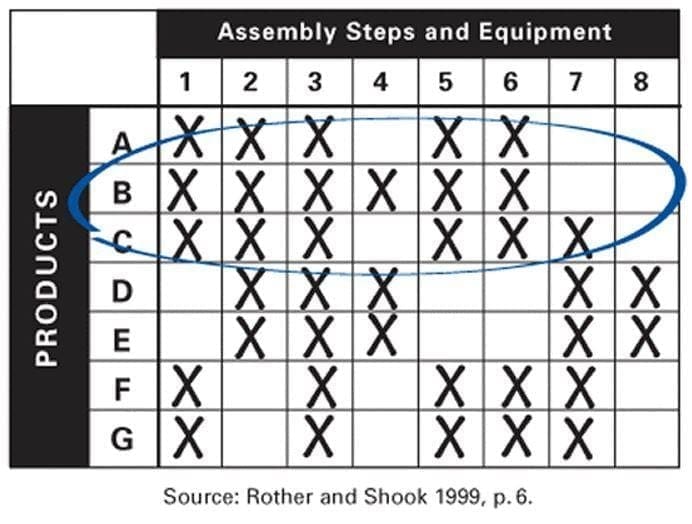
To define our focus, we can use a tool like a Product Family Matrix help us understand which of the products or family of products has the “biggest bang for the buck”.
An example of the Product Family Matrix
When choosing the product or product family to map, consider:
- Customer Return Rates
- Greater Proportion of Units
- Largest Dollar Volume
- Defect Rates
- Complex Products (use the most processes)
Once we understand and define value for the organization and we understand the focus, we now start to develop the VSM.
I have worked with hundreds of teams and have found that developing a Value Stream Map manually with Post It notes and flip charts work best.
Step 3 – Go to Gemba (Walk the Process)
I see lots of teams draw a VSM in a room far removed from the process that they are trying to improve. Worse, they try and develop a VSM from reports and SME accounts without ever experiencing the process themselves.
Go to Gemba! Draw the Ohno Circle! Get a notepad, take notes and watch the process unfold in front of you.
Step 4 – Work Backwards
The most difficult part to drawing a VSM is not to turn it into a flowchart where we track all of the different paths of the process. There is a trick to avoiding that mistake … Start from the end of the process and work backwards
When you start from the end customer and work backwards, you have no choice but to track that “one thing”.
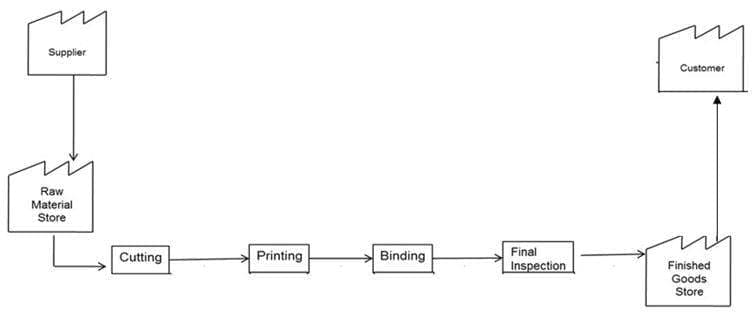
Step 5 – Define the basic value stream
From the data that we have collected from “going to gemba” and SME’s, we define the basic steps in the value stream
Step 6 – Fill in Queue Times
After we define the basic steps in the value stream then we fill in Waiting (Queue) Times between each process.
In most VSM’s, the focus is on the Process Cycle Time. Separate the cycle times between NVA time and VA time. Recall our discussion in Step #1 to define what is considered to be a Value Added Step (VA)
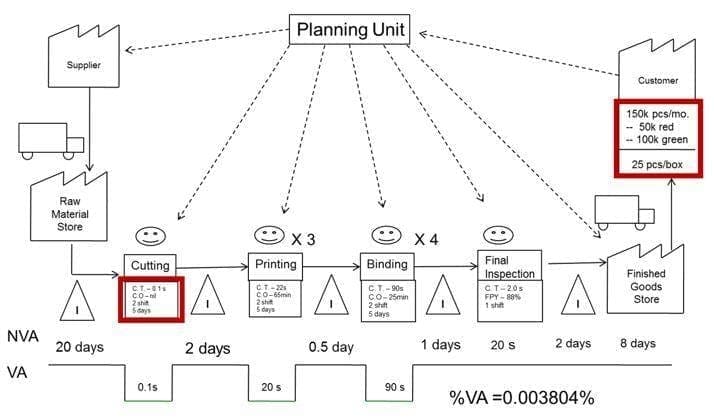
Step 7 – Fill in Process Data
Enter all pertinent process data in Boxes beneath each main process step box (from step #5).
Examples of Process Data:
- Process Cycle Time
- Changeover Time
- Pace / TAKT Time / Rate
- Defects / Problems Per Day
- First Pass Yield
- Batch Size
- Shifts
Enter any data that you and the team have defined important to the process
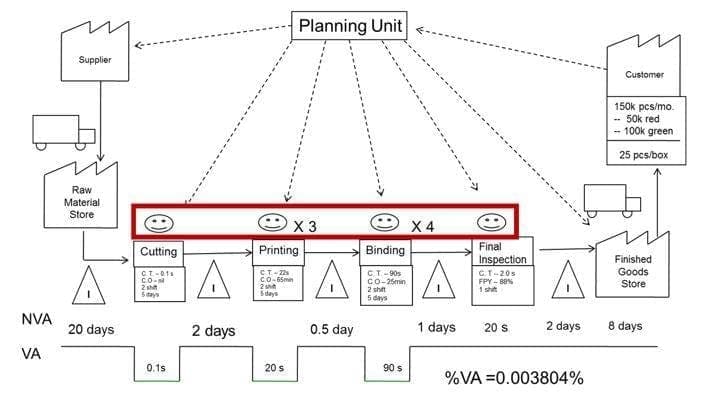
It is important to understand the amount of capacity in labor at each process. When developing the VSM, you might see that a bottleneck exists because of an imbalance in labor.
Add a smiley face over each process box to define the number of laborers that we were in the process when the value stream was captured.
Step 9 – Add the Value Added Percentage (%VA)
Add up all the data in the VA section and divide it by the total process cycle time (the time it takes for the product or product family to travel through the entire value stream)
Convert the resulting number to a percentage (%) by multiplying by 100. This will give you the Percentage of Value Added activities or %VA.
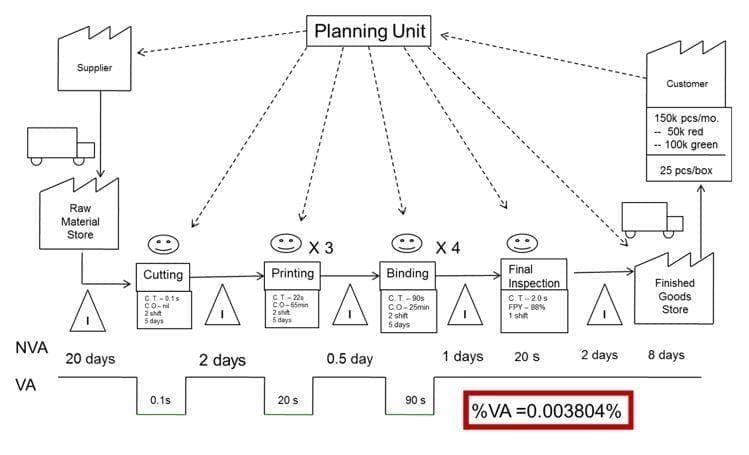
Step 10 – interpret the VSM?
The VSM should now be a very pictorial view of the process and what has happened to that product or family of products.
- Bottlenecks / Constraints
- Long Process Cycle Times
- Poor Uptimes
- Excessive Setup Times
- Poor Quality / Rework
The VSM should help build a roadmap for continuous improvement projects to get your process to the desired state.
Develop the VSM somewhere that the team has quick and easy access to the process. Optimally you will be at the process.
7. Look for the 6’ View
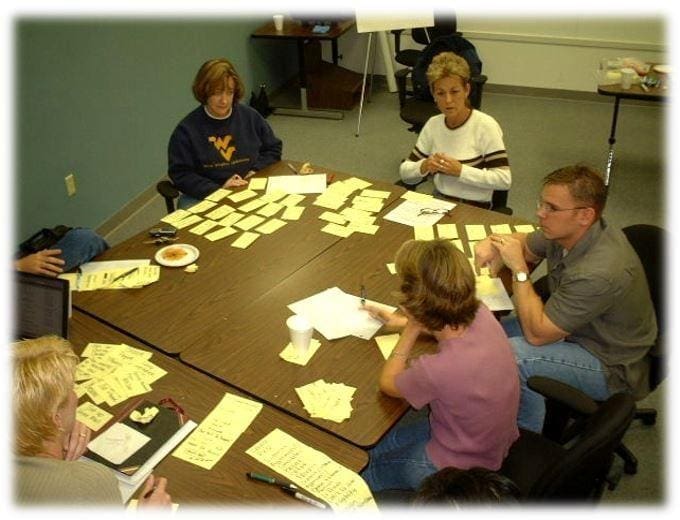
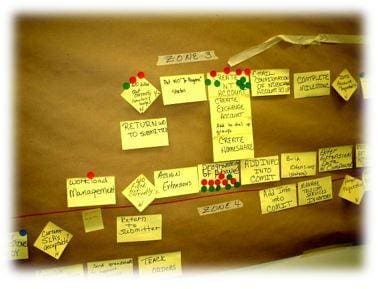
I have sat through countless process mapping sessions in my career as a Lean Six Sigma practitioner. I will draw a picture in your minds as what those sessions looked like.
One person (we will call the Scribe) was volunteered to stand and write the steps either on post-it notes or directly on a flip chart taped to a wall.
The rest of the team was sitting at a board room table calling out steps. Heckling the Scribe if he made a mistake or couldn’t keep up with the steps being called out.
This is a process dominated by “those that yell the loudest”. In a process mapping session like this, many people will disengage.
This method of process mapping is also very siloed. All information flows through the Scribe. This leads to frustration.
The whole Lean Six Sigma Project Team is not optimized to produce an effective process map.
I’m going to show you a method to developing a process map that will blow your mind in the speed of development and the amount of information produced!
First, we need some supplies:
- Post-it Self-Stick Easel Pad, 25 x 30.5 Inches, 30-Sheet Pad
- Post-it Super Sticky Notes, 3 x 3-Inches (Green, Yellow, Red, Purple and Blue)
- Avery Print/Write Self-Adhesive Removable Labels, 0.75 Inch Diameter, Green Neon
- Avery Print/Write Self-Adhesive Removable Labels, 0.75 Inch Diameter, Red
- Kraft Paper Jumbo Roll – 30″ x 1200″
The process map you will develop is a part of the SIPOC which stand for Supplier, Input, Process, Output and Customer.
We use a single Post-it Self-Stick Easel Pad, 25 x 30.5 Inches for Suppliers and Inputs and we use another for Outputs and Customers.
On a wall in a training room or a board room, write “Suppliers” and “Inputs” on a single Post-it Self-Stick Easel Pad, 25 x 30.5 Inches. Place on the left side of the wall (see picture below)
On a wall in a training room or a board room, write “Output” and “Customers” on a single Post-it Self-Stick Easel Pad, 25 x 30.5 Inches. Place on the right side of the wall (see picture below)
In between the in between the single Post-it Self-Stick Easel Pad with “Suppliers” and “Inputs” and the single Post-it Self-Stick Easel Pad with “Outputs” and “Customers”, unroll the Kraft Paper Jumbo Roll and tape to the wall. This is where we will put the “O” (or Output) of the SIPOC (see picture below).
Step #1 – Developing the O&C (Output and Customer) of the SIPOC
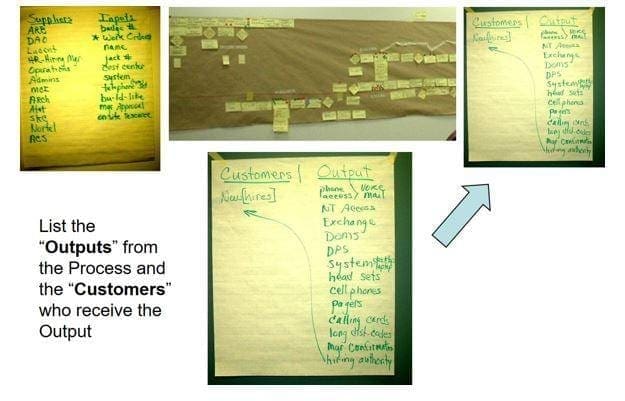
When defining the “Outputs” of the Process:
- Use nouns not action words (for example, Taste, Texture, Time, Length)
- What does this process produce?
- This shouldn’t be written in the Positive (like “Good Taste”) or Negative Sense (like “Bad Taste”) only in the Neutral Sense (like “Taste”)
When Defining the “Customers” of the Process:
- Who are the “Internal Customers”?
- Who are the “External Customers”?
- Who will benefit from this process?
- Who will be upset if this process doesn’t work as required?
Step #2 – Developing the S&I (Suppliers and Inputs) of the SIPOC
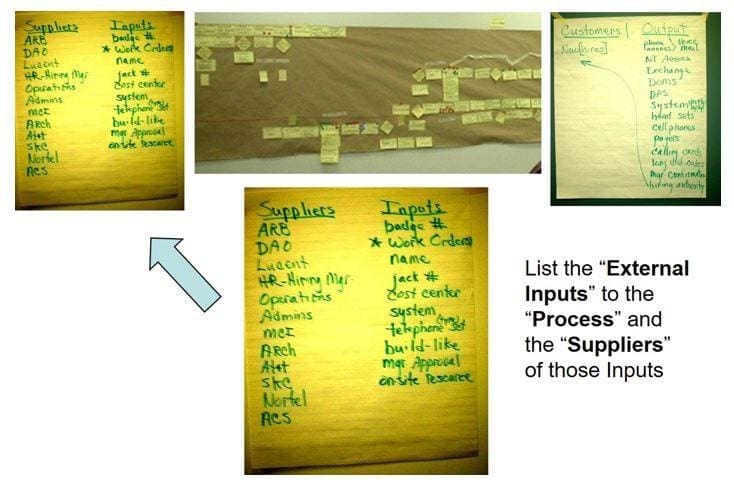
When Defining the External “Inputs” into the Process:
- The External Inputs are those Inputs are fed to the process for the process to work
- These “External Inputs” are external to the “Process” that our Six Sigma Project is Focused.
Defining the External Inputs is a Critical Element of the SIPOC.
I like to use the example of Mowing a Lawn to describe the SIPOC and particularly the “I” in the SIPOC. The Scope of “The Process” of mowing the lawn is the “P” in the SIPOC. The “External Inputs” (left of the Process) are those things that have to be fed to the process in order for the process to work.
Let’s say that the Scope of The Process of Mowing the Lawn starts with: You are standing behind the lawnmower, it is running and ready to mow the lawn. What is fed to The Process in order for the Process to Work?
- Someone (or Something) to push the lawnmower
- A Lawnmower
- Knowledge of how to work the lawnmower
- Proper Weather
Why is it important to understand our Internal Inputs?
Our focus during the Lean and Six Sigma Project will be on the “P” in the SIPOC. What if we are focused on the wrong process?
By understanding our External Inputs, we might find one or more External Inputs have a significant effect on our “Process Output”.
By not addressing that External Input, we may not make a significant enough improvement to our Process Output.
One of the Most Powerful aspects of a SIPOC is to help a project team determine if they have the right focus.
Generating the “P” in the SIPOC (the Process Map)
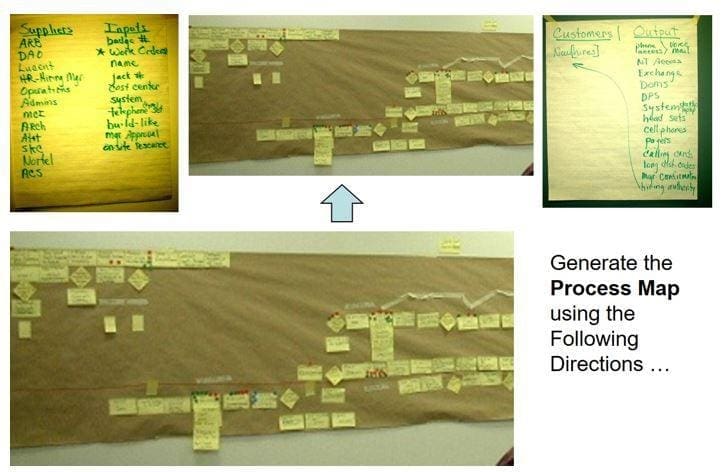
Step #3 – Generating the Process Map – Individual Task Descriptions
In this step the team is going to write out on a notepad how they “see” the process being performed.
I like to get my teams to do this days before we have the process mapping session. I ask them to spend time at the process watching the process in action.
Below are the steps to for the project team to define the process as they “see” it.
- INDIVIDUALLY and SILENTLY (Do not talk to each other or compare notes)
- On a Notepad write a List of Each Task (Minimum: Verb and Noun) that you do in this process OR that you know that someone else does in this process
- A task can be ANY ACTIVITY that occurs between the start point and end-point you defined in the previous step
- Just list the task, NOT who does it.
Step #4 – Generating the Process Map: “Round Robin”
- Choose the Most Experienced Person in the Room
- Have that person read each of the tasks in order from their list of tasks
- Others on the team can interject and add, Nod in Agreement or BRIEFLY Ask for Clarification (30 second limit)
- If that exact task is duplicated on a team members list, cross it off your list
- Once everyone understands the task, write the task on a Post-it Note
- Write the task on a Post-It note according to its Value Add Activity (Red = NVA, Yellow = BVA, Green = CVA).
- Continue until all tasks on all lists are documented
- Place all Post-It notes in the middle of the table
Step #5 – Generating the Process Map: Affinity Grouping
In this step, we group the post-it notes by their relationships (or Affinities) to each other. For Example, there may be a group of Post-It notes that are Inspections or Vetting of a Product or Transaction. In this case, we would put them together in a group called “Vetting”.
Below are the steps to for the project team to group the steps by the relationship (or affinity) to each other.
- INDIVIDUALLY and SILENTLY
- Group the Post-it Notes into logical “clusters” that belong together
- Team Members may change the groupings
- If the same task truly belongs in more than one cluster, make a second copy of the Post-it note and place in the second cluster
THIS IS A TEAM ACTIVITY
- Group the Clusters by their affinity (or Relationship to each other)
- Example: The affinities could be functions (i.e. QA, Design, Production, etc.)
- Name each Cluster of activities
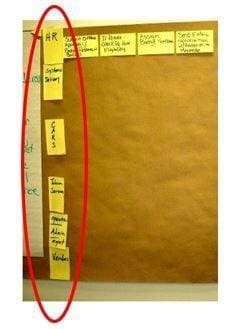
- These will eventually be the Swim Lanes in a Swim Lane Map (Process Map)
- Create a large Post-it note for Each Clusters Name
Step #6 – Generating the Process Map: Final Process Mapping
Now that we have the grouping of the Tasks, it is now time to put Post-it’s on the wall.
- THIS IS A TEAM ACTIVITY
- Place the Clusters in “Swim Lanes” on the wall vertically
Next step is to add the tasks in time order from left to right. This is what we call “building the skeleton” of the process map.
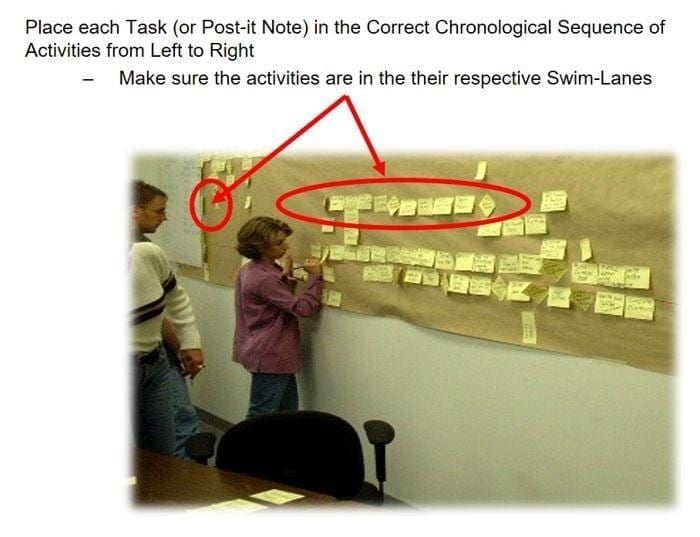
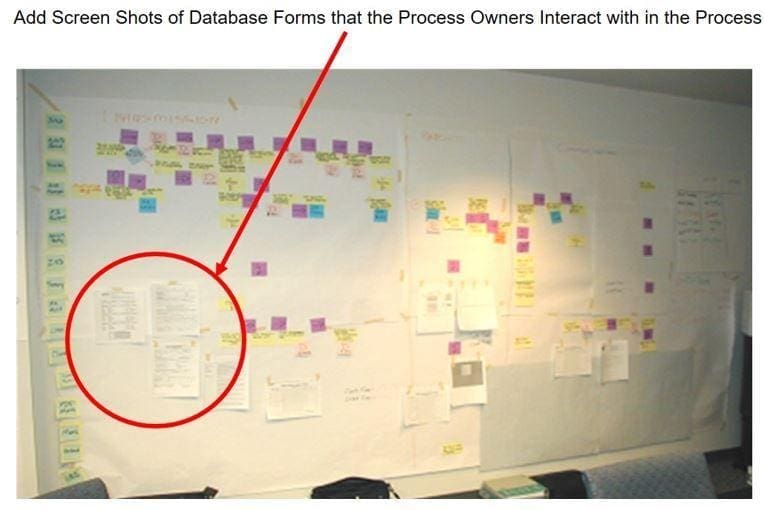
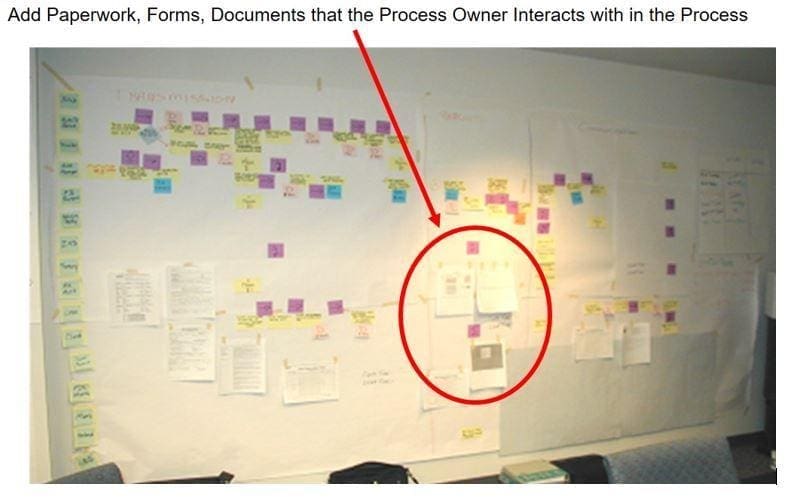
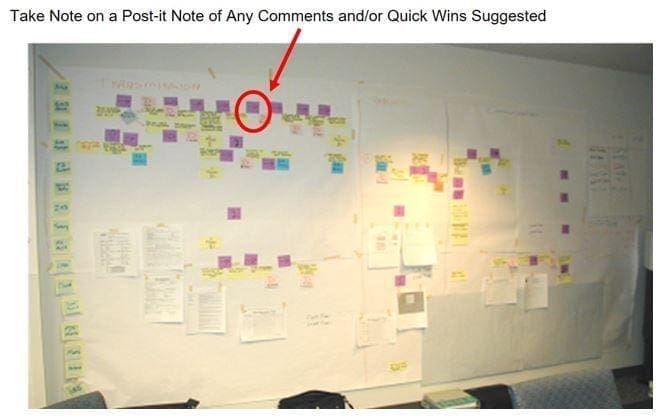
The next step is we call “Adding the Muscle to the Bones”. In this step we will fill in Decisions, Add Paperwork, Screen Shots and any other Complexities to the Process.
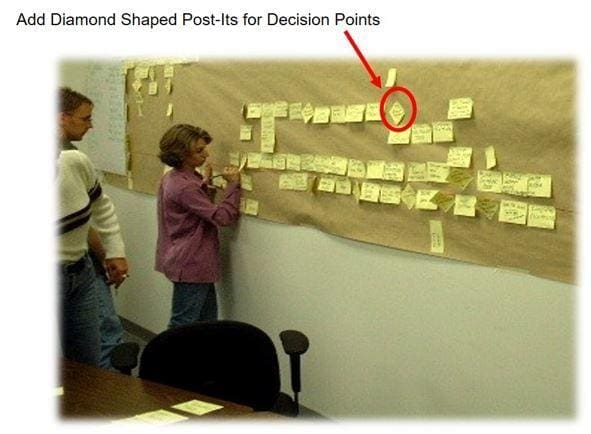
Step #7 Identify Key Process Steps
This is a critical step in generating the Process Map. Once we have the detail populated on the Process Map, now it is time for the project team members who work in the process (or process owners) being investigated to define the critical inputs (or critical tasks).
Below are the steps for the process owners to define the critical inputs:
- Each Person gets Three Red Dots to vote on their biggest perceived problem areas
- Each Process Owner Puts the Three Red Dots on the Tasks that you believe the Problem Areas are located
- You can place one dot on three different tasks or you can place more than one dot per task
Optional Activity- Place Three Green Dots on the Area’s that you believe the “Process Improvements” are located
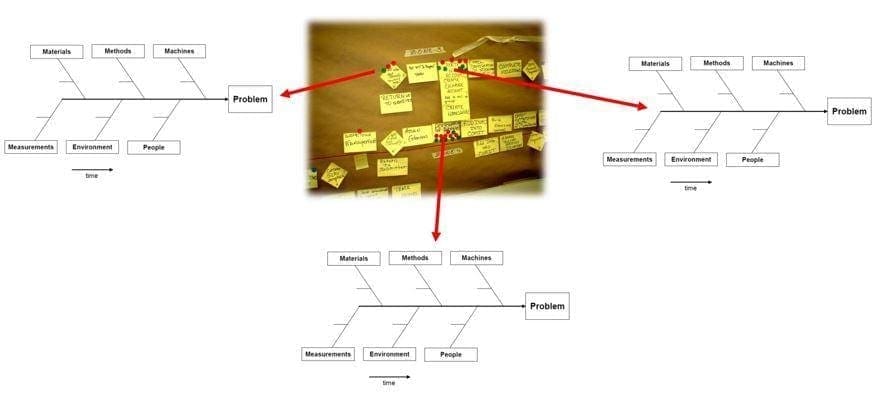
Once you have defined the Critical Inputs to the Process, you can know use Root Cause Analysis tools like the Fishbone or FMEA to dig deeper.
8. Decipher the Code
Have you have ever watched “The Christmas Story”? There is a scene when Ralphie is trying to decode the Code that he has compiled over weeks of listening to a Little Orphan Annie Radio Show.
He had to have the secret decoder ring to decipher the message.

We are in the same predicament that Ralphie was in. The process is trying to tell us something but it is in code.
We can’t decipher that code until we have the “Decoder Ring”.
The “Decoder Ring” in our case is Statistical Analyses through any of the many tools like Minitab or SAS.
The code is given to us in data. We can collect this data in a Multi-Vari Data collection sheet like the example below:
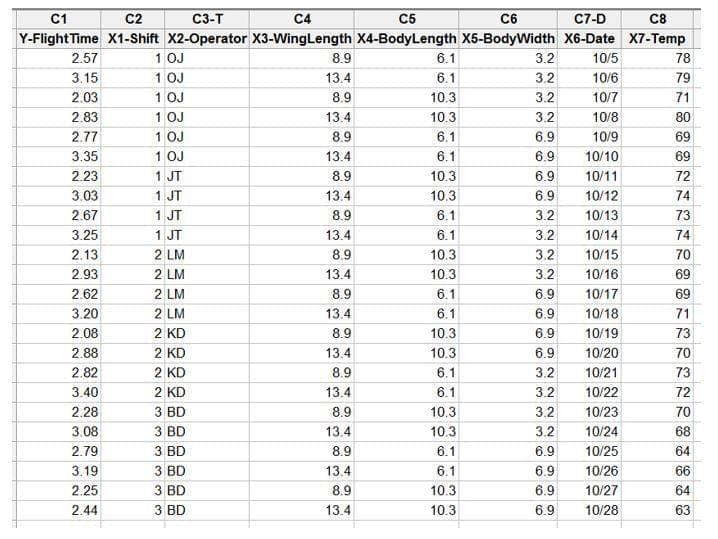
Now it is time to use the Statistical Tools that you leaned in your Lean Six Sigma Course to find the Statistically Significant X’s
9. Prioritize and Manage
At this point, we should know the Key X’s that need to be improved, optimized and controlled. We should know what the tasks are to Improve each of the Key X’s.
It is now time to prioritize the Improvement Tasks.
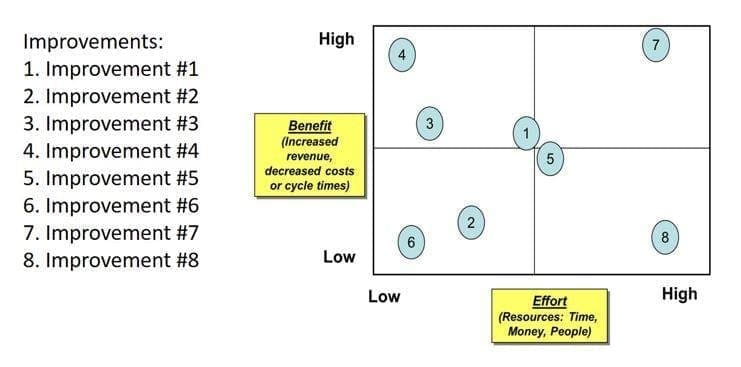
We use a simple tool called the “Payoff Matrix”.
This tool helps us prioritize our Improvement Tasks based on Benefit and Effort.
We define benefit as the Impact to a KPI.
Effort could be defined many ways. It is basically the cost in time, money and other resources to implement the improvement.
The picture below is an example of a “Payoff Matrix. We usually have a flip chart with the numbered list of improvements and another flip chart for the matrix.
Once the Improvement Tasks have been prioritized, it is time to Project Manage the Improvement Tasks. The GANNT Chart below can be downloaded from Microsoft Office Download Site.
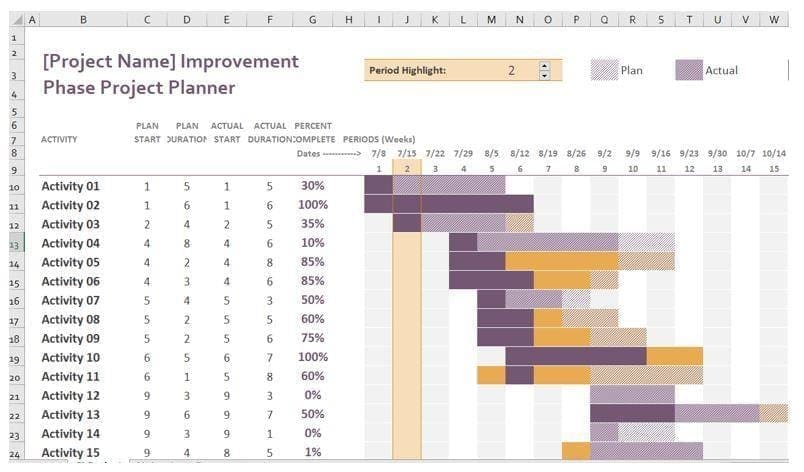
As you implement these Improvement Tasks, you can watch your Time Series chart that is tracking your Y or Y’s to see the impact.
See below for an example:
10. Mime’s make the Best Operators

I tell my students in the beginning of our Lean Certification class that “the best improvement creates a process where the operators do not need to talk”.
I usually get a perplexed look from this statement.
As we progress through the class and play several simulations, they start to understand my statement.
In our last simulation, we play a Lean Game where they employ the tools of Pull/Kanban, Flow/Takt Time, Poke Yoke and Visual Signaling to produce a seemingly Impossible task.
The class is amazed as we exceed the requirements of the simulation without saying a word.
The class now understands that If we had effective visual signals and visual data, then the process would talk to us. The process would tell us how we are performing.
The process would tell us what to do next. We would understand the next in the priority. We would have signals to let us know if we are going too fast or slow.
I see a lot of improvements that are titled “Training” and “More Accountability”, but these improvements are “Solving the Problem with the Same Thinking that Created the Problem”, something that Albert Einstein warned us about.
As you and your team of SME’s develop the improvements to the process, ask these three questions for each improvement:
- Are we Removing Post It notes from the Wall?
This means am I reducing complexity (or steps) … Or am I Removing one Post It note and just replacing it with another.
- Are we reducing Decisions?
We tend to think that better training is going to solve the problem. Training doesn’t reduce decisions, it just makes the operator “accountable” for making the right decision.
I tell my students that “Training” should not be included on their Improvement Task list.
Instead, we should work towards prioritizing and removing the decisions be that do not need to made.
- Do the Operators need to Verbally Communicate?
If the improvement has an operator communicating to another operator the next step, current performance, or any other critical information, then we are trusting that the operator is providing the right information. That is a dangerous assumption to make.
Let the Process tell the operator what to do next! This could be in the form of a Heijunka Solution to level load production. It could be a KanBan to signal replenishment of Raw Material, Components or Finished Goods.
Follow these 10 Simple Steps to conduct a Lean Six Sigma Project and they Will Give Amazing Results Every Time!
Please let us know in the comments below how these steps helped (or didn’t help) you in your Lean Six Sigma project.[/et_bloom_locked]


Six sigma white belt certification is good