

Inferential statistics is a branch of statistics that allows us to make predictions or inferences about a larger population based on the data we gather from a smaller sample.
This field of statistics provides tools and methods for analyzing a sample. It helps conclude the population from which the sample is taken. By doing so, inferential statistics helps us understand trends, make predictions, and test hypotheses, even when it is not feasible to study the entire population directly.
Table of contents
- What is Inferential Statistics?
- Parameters and Statistics
- Estimation in Inferential Statistics
- Sampling and Sampling Distribution
- Hypothesis Testing
- Common Inferential Techniques
- Role of Sampling Error
- Importance of Sample Size
- Practical Applications of Inferential Statistics
- FAQ: What is the appropriate comparison distribution for an inferential statistic?
- Final Words
- Related Articles
What is Inferential Statistics?
At its core, inferential statistics involves generalizing from a sample to a population. A population is the entire group that you are interested in studying. A sample represents a subset of that population. You select the sample because collecting data from every member of the population is often impractical or impossible.
For example, if you want to know the average height of adults in a country, it would be extremely difficult to measure every adult’s height. Instead, you would measure a sample and use inferential statistics to estimate the average height for the entire population.
Parameters and Statistics
In inferential statistics, it is essential to distinguish between parameters and statistics. Parameters are numerical characteristics of a population, such as the population mean (denoted by μ) or population standard deviation (denoted by σ). Statistics, on the other hand, are numerical characteristics of a sample, such as the sample mean (denoted by x̄) or sample standard deviation (denoted by s).
The primary goal of inferential statistics is to estimate population parameters based on sample statistics. We deal with a sample rather than the entire population. Therefore, these estimates always involve some degree of uncertainty.
Inferential statistics provides methods to quantify this uncertainty and to make informed conclusions about the population.
Estimation in Inferential Statistics
One of the primary functions of inferential statistics is estimation. Estimation involves using sample data to estimate the value of a population parameter. There are two main types of estimation: point estimation and interval estimation.
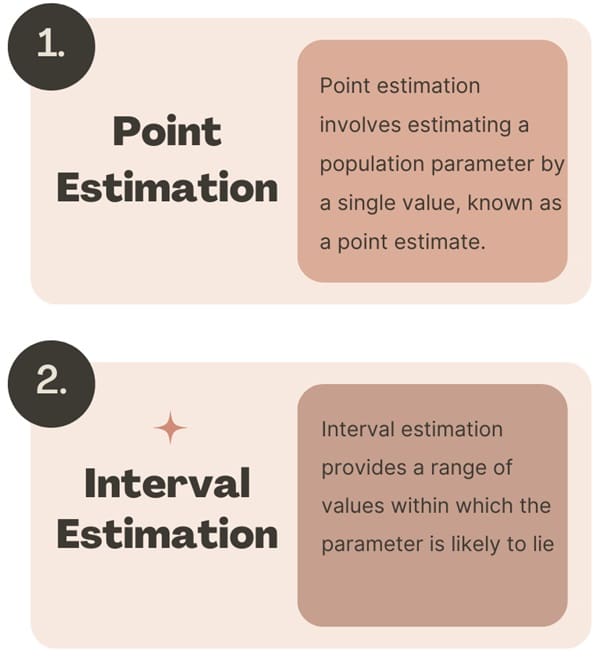
Point Estimation
Point estimation involves estimating a population parameter by a single value, known as a point estimate. For example, the sample mean (x̄) is often used as a point estimate for the population mean (μ). The key question in point estimation is how close the sample statistic is to the population parameter.
A good point estimator should be unbiased, meaning that the expected value of the estimator is equal to the true population parameter. It should also be consistent, meaning that as the sample size increases, the estimator becomes increasingly accurate.
Interval Estimation
While point estimation provides a single estimate of a population parameter, interval estimation provides a range of values within which the parameter is likely to lie. This range is known as a confidence interval.
For example, a 95% confidence interval for the population mean might range from 45 to 50, meaning that we can be 95% confident that the true population mean falls within this interval. Confidence intervals are important because they provide a measure of the uncertainty associated with an estimate.
Sampling and Sampling Distribution
A critical concept in inferential statistics is the sampling distribution, which is the probability distribution of a given statistic based on a random sample. The sampling distribution is central to many inferential techniques, including hypothesis testing and the construction of confidence intervals.
The sampling distribution of the sample mean, for example, is the distribution of sample means that we would obtain if we repeatedly took samples of a given size from the population. The Central Limit Theorem states that the sampling distribution of the sample mean will approximate a normal distribution.
This holds true regardless of the population distribution, as long as the sample size is sufficiently large. This property allows us to use the normal distribution as a basis for making inferences about the population mean.
Hypothesis Testing
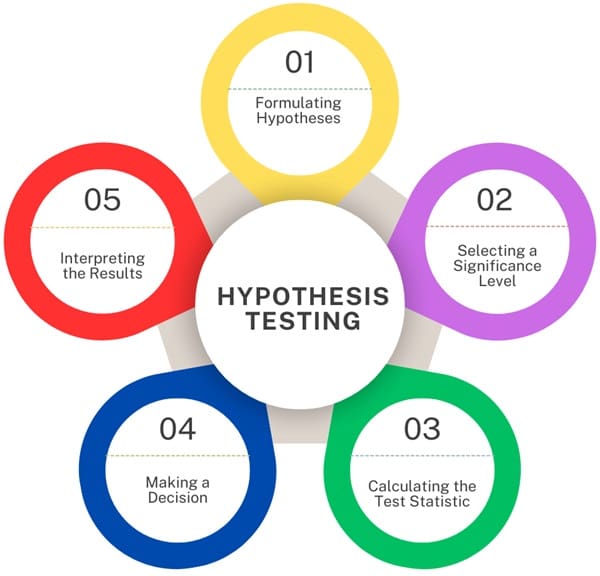
Hypothesis testing is another fundamental aspect of inferential statistics. It is a method used to test a hypothesis about a population parameter based on sample data. Hypothesis testing involves several key steps:
- Formulating Hypotheses: First, you formulate a null hypothesis (H₀) and an alternative hypothesis (H₁). The null hypothesis typically represents a statement of no effect or no difference, while the alternative hypothesis represents what you are trying to prove.
- Selecting a Significance Level: The significance level (denoted by α) is the probability of rejecting the null hypothesis when it is actually true. A common significance level is 0.05, meaning there is a 5% risk of concluding that a difference exists when there is no actual difference.
- Calculating the Test Statistic: The standardized test statistic is calculated from the sample data. We use this value in hypothesis testing. We compare it to a critical value from a statistical distribution, such as the normal distribution, to decide whether to reject the null hypothesis.
- Making a Decision: Based on the comparison of the test statistic and the critical value, you decide whether to reject or fail to reject the null hypothesis. If the test statistic falls into the critical region, you reject the null hypothesis, suggesting that there is sufficient evidence to support the alternative hypothesis.
- Interpreting the Results: The final step is to interpret the results in the context of the research question. If you rejected the null hypothesis, you might conclude that there is evidence to support your alternative hypothesis. If you failed to reject the null hypothesis, you might conclude that there is not enough evidence to support your alternative hypothesis.
Common Inferential Techniques
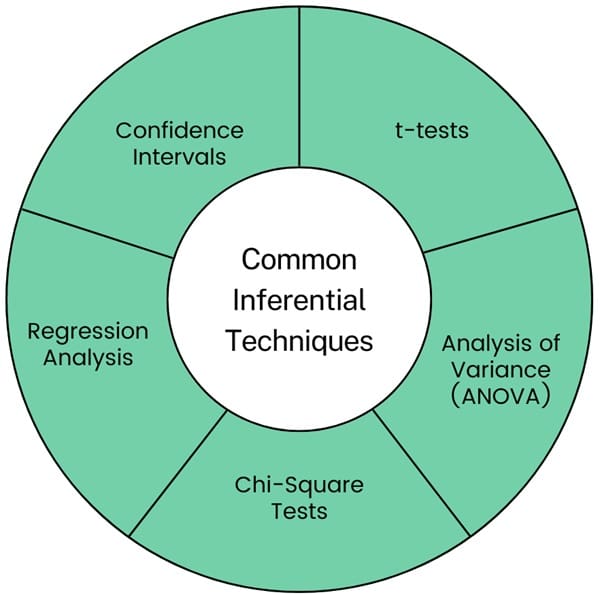
Several statistical techniques are commonly used in inferential statistics, including:
- t-tests: t-Tests are used to compare the means of two groups to determine if they are significantly different from each other. There are different types of t-tests, such as independent t-tests (for comparing means from two different groups) and paired t-tests (for comparing means from the same group at different times).
- Analysis of Variance (ANOVA): ANOVA compares the means of three or more groups. It determines if at least one group mean is significantly different from the others. It is an extension of the t-test for more than two groups.
- Chi-Square Tests: Chi-square tests are used to examine the relationship between two categorical variables. The test compares the observed frequencies of events to the expected frequencies under the null hypothesis.
- Regression Analysis: We use regression analysis to examine the relationship between a dependent variable and one or more independent variables. It allows for the prediction of the dependent variable based on the values of the independent variables.
- Confidence Intervals: Confidence intervals provide a range of values within which a population parameter is likely to fall. We often use them in conjunction with point estimates. This approach provides a more complete picture of the uncertainty associated with the estimate.
Also See: Lean Six Sigma Certification Programs, Bakersfield, California
Role of Sampling Error
One of the key challenges in inferential statistics is dealing with sampling error, which is the difference between a sample statistic and the corresponding population parameter. Sampling error arises because a sample is only a subset of the population, and different samples will yield different statistics.
Inferential statistics provides methods to estimate the magnitude of sampling error and to account for it in our inferences. For example, the standard error of the mean is a measure of the variability of the sample mean and is used to construct confidence intervals and conduct hypothesis tests.
The standard error decreases as the sample size increases, making larger samples more reliable for making inferences about the population.
Importance of Sample Size
The size of the sample plays a crucial role in inferential statistics. Larger samples tend to produce more accurate and reliable estimates of population parameters because they reduce the impact of sampling error.
However, larger samples are also more costly and time-consuming to collect, so there is often a trade-off between the precision of the estimates and the resources available for data collection.
In practice, researchers must carefully consider the sample size when designing studies. Techniques such as power analysis can help determine the appropriate sample size needed to detect an effect of a given size with a certain level of confidence.
Practical Applications of Inferential Statistics
Researchers widely use inferential statistics in various fields, including medicine, psychology, economics, and social sciences. For example:
- In medicine, researchers use inferential statistics to determine the effectiveness of new treatments or drugs. They compare outcomes between treatment and control groups.
- In psychology, researchers apply inferential statistics to test theories about human behaviour and mental processes. They analyze data from experiments and surveys.
- In economics, experts use inferential statistics to predict economic trends. They analyze sample data to forecast inflation rates or unemployment rates.
- In social sciences, researchers use inferential statistics to understand relationships between variables. They study impacts, such as how education affects income.
FAQ: What is the appropriate comparison distribution for an inferential statistic?
The appropriate comparison distribution for an inferential statistic is the sampling distribution. specifically, it is the distribution of scores that would occur if the null hypothesis were true. In Six Sigma, we use this concept to determine if a process improvement is statistically significant or just random noise.
Final Words
Inferential statistics is a powerful tool that allows researchers to make generalizations about populations based on sample data. By using methods such as estimation, hypothesis testing, and regression analysis, inferential statistics enables us to draw conclusions, make predictions, and test theories even when it is not possible to study the entire population.
Despite the challenges of sampling error and the need for careful study design, inferential statistics plays a crucial role in advancing knowledge and informing decision-making in a wide range of disciplines.

Tired of confusing statistics theory? Learn how to actually Apply it. Our Lean Six Six Sigma Green Belt certification skips the academic fluff and teaches you how to use these tools in Minitab/SigmaXL to save money and get promoted.
About Six Sigma Development Solutions, Inc.
Six Sigma Development Solutions, Inc. offers onsite, public, and virtual Lean Six Sigma certification training. We are an Accredited Training Organization by the IASSC (International Association of Six Sigma Certification). We offer Lean Six Sigma Green Belt, Black Belt, and Yellow Belt, as well as LEAN certifications.
Book a Call and Let us know how we can help meet your training needs.


