
In statistics, we calculate sample statistics as numerical values directly from a subset, or “sample,” of a larger population. We use these statistics to estimate or infer population characteristics because measuring every single member of a population is often impractical or impossible.
By studying a smaller, manageable group, we can make reasonable predictions and draw conclusions about a larger group.
Sample statistics are values that summarize or provide insights into the characteristics of a sample. They include common measurements such as the mean, median, variance, standard deviation, and proportions. Essentially, these statistics help us make inferences about the population as a whole.
For example, consider a research study looking at the average income of people living in a country. Instead of surveying every person nationwide (a time-consuming and costly process), researchers choose a random sample of people and calculate sample statistics, such as the sample mean (average income). Then, they use these sample statistics to estimate the average income of the entire population.
Here’s a breakdown of what sample statistics are and why they are so important:
Table of contents
What Are Sample Statistics?
Sample statistics represent values we calculate directly from a subset (or sample) of a larger population.
Our purpose in using these statistics is to gain insights about the population from which the sample originates. While crucial for estimating population parameters, remember that sample statistics themselves exhibit variability because they come from only a portion of the entire population.
As a result, understanding their role and properties is essential for accurate data analysis.
Purpose of Sample Statistics
Sample statistics are typically used in two key ways:
- Summarizing Sample Characteristics: Just as population parameters (such as the mean or variance) describe the characteristics of an entire population, sample statistics summarize the key features of a sample. For example, in a study about the heights of students at a university, the sample mean height serves as a summary of the data collected from the sample group.
- Estimating Population Parameters: More importantly, sample statistics are used to make inferences about the broader population. Since it’s often impractical or impossible to measure every member of a population, sample statistics provide a way to estimate parameters like the population mean or variance.
The field of statistics, particularly inferential statistics, focuses on the use of sample statistics to make conclusions about a population based on sample data. For instance, you may collect a sample of students’ heights to estimate the average height of all students in a university.
Properties of Sample Statistics
The properties of sample statistics are essential to understanding how well they estimate the true population parameters. Two of the most important characteristics are:
- Bias: We consider a statistic unbiased when its expected value (or mean) equals the population parameter it aims to estimate. Conversely, if the statistic consistently overestimates or underestimates the population parameter, we classify it as biased.
For example, if the mean height from a sample of students consistently overestimates the true population mean, then the sample mean is biased. On the other hand, if it provides an accurate estimate on average, it is unbiased.
- Standard Error: The standard error of a statistic measures the amount of variability or uncertainty associated with the statistic. The standard error is essentially the standard deviation of the sampling distribution of the statistic. The smaller the standard error, the more precise the estimate of the population parameter.
For example, if you repeatedly draw samples from a population and calculate the sample mean each time, the standard deviation of those means is the standard error. A larger sample size typically leads to a smaller standard error, as the sample mean becomes a more reliable estimate of the population mean.
How to Interpret Sample Statistics?
Once sample statistics are calculated, they can be used to make inferences about the population. However, it’s important to remember that sample statistics are estimates and are subject to error. For instance, a sample mean will likely differ from the true population mean due to sampling error.
To increase confidence in the estimates made from sample statistics, statistical methods like confidence intervals and hypothesis testing can be used. These methods allow statisticians to quantify the uncertainty and make more informed decisions based on sample data.
Two Major Branches of Statistics
There are two major areas of statistics that use sample statistics:
- Descriptive Statistics: This area is concerned with summarizing and organizing data to make it easier to understand. It includes measures like the mean, median, and standard deviation, along with visual aids such as graphs and charts.
- Inferential Statistics: This branch is where sample statistics play a vital role. It focuses on drawing conclusions about a population based on the information obtained from a sample. This process typically involves hypothesis testing, estimation, and prediction.
Importance of Sample Statistics in Inferential Statistics
In inferential statistics, the goal is to draw conclusions about a population based on a sample. Sample statistics like the mean and variance serve as the foundation for statistical inference. By understanding the properties of sample statistics, we can make more reliable inferences about the population, even when we cannot measure every individual in the population.
For example, if you want to know whether the average height of students at UR differs significantly from those at VCU, you would collect samples of students from each university and compare the sample means. Using sample statistics, you can estimate the population means and assess the likelihood that any observed differences are due to random chance.
Key Sample Statistics
Among the various types of sample statistics, two stand out as particularly important: the sample mean and sample variance. These statistics give us key information about the central tendency and variability of the sample data, and are often used to estimate their population counterparts.
1. Sample Mean
The sample mean is the average of the data points in a sample. It is calculated by summing all the observations in the sample and then dividing by the number of observations (n).
Formula:
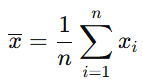
Where:
- xˉ\bar{x}xˉ is the sample mean
- nnn is the number of observations in the sample
- xix_ixi represents each individual data point
For example, if you measure the heights of 10 students at a university and obtain heights of 70, 72, 68, etc., the sample mean would be the sum of those heights divided by 10.
2. Sample Variance
The sample variance measures the spread or dispersion of data points in a sample. It tells us how far the data points are from the sample mean, on average. The formula for sample variance varies depending on whether the true population mean is known. Generally, when the population mean is not known, the sample mean is used as an estimate, and the formula adjusts to account for this.
Formula (when the population mean is unknown):

Where:
- s2s^2s2 is the sample variance
- xˉ\bar{x}xˉ is the sample mean
- nnn is the sample size
- xix_ixi represents each individual data point
This formula uses n−1n-1n−1 in the denominator to provide an unbiased estimate of the population variance. The reason for this adjustment is that using the sample mean instead of the population mean introduces an additional error, which is accounted for by reducing the denominator by 1.
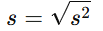
3. Sample Standard Deviation
The sample standard deviation (denoted as sss) is simply the square root of the sample variance. It tells you how much the values in the sample differ, on average, from the sample mean. A larger standard deviation indicates more spread out data, while a smaller standard deviation suggests the data are closer to the mean.
Formula for Sample Standard Deviation:
Sample Statistics vs. Population Parameters
It’s crucial to understand the difference between sample statistics and population parameters:
- Population Parameters: These are values that describe the entire population. For instance, the population mean (µ) and population variance (σ²) are fixed values that don’t change, as they are based on the entire population.
- Sample Statistics: These are calculated from a sample and are used to estimate the corresponding population parameters. They are considered random variables because the values can change depending on the specific sample chosen.
| Feature | Sample Statistic | Population Parameter |
|---|---|---|
| Definition | A calculated measure describing a sample of data. Useful for statistical analysis. | A true value describing the entire population. Often the target of statistical inference. |
| Source of Information | Derived directly from the sample data collected. | Determined from examining every member of the population. |
| Variability Across Samples | Varies from one sample to another. This is key in understanding sampling error. | Generally considered a fixed, unknown value. |
| Common Notations | Sample Mean (x̄), Sample Standard Deviation (s), Sample Proportion (p̂). | Population Mean (μ), Population Standard Deviation (σ), Population Proportion (P). |
| Primary Use in Statistics | To estimate population parameters and perform hypothesis testing about the population. | To describe a specific characteristic of the entire group. Often the parameter we want to know. |
| Feasibility of Obtaining | Typically easier and more cost-effective to calculate. | Often difficult, expensive, or impossible to obtain, especially for large populations. |
| Knowledge Status | Known once the sample has been analyzed. | Usually unknown, which is why we use sample statistics for estimation. |
Example
Let’s say we want to compare the average height of students at two universities, UR and VCU. If we measure the height of every student at both universities, we would obtain population parameters (mean height, variance, etc.).
However, since this is often not feasible, we can instead measure a random sample of students at each university. The sample mean height is then a statistic that we use to estimate the population mean height.
Estimating Population Parameters Using Sample Statistics
When we use sample statistics to estimate population parameters, we generally aim for estimates that are both unbiased (accurate on average) and precise (with low variability). To minimize sampling error, statisticians often recommend using larger sample sizes. This is because larger samples tend to provide more accurate estimates of the population parameters, and the sample statistics are less likely to be affected by outliers or random variations.
For instance, if you randomly sample the heights of 10 students from a university, the sample mean might not perfectly match the true population mean. However, if you sample 100 students, the sample mean will likely be closer to the population mean due to the larger sample size.
Concept of Sampling Error
Sampling error refers to the difference between a sample statistic and the corresponding population parameter. Because we are only working with a subset of the population, sample statistics are not always identical to the true population parameters. The larger the sample, the more accurate the sample statistics will typically be in estimating the population parameters.
For example, imagine you draw two different samples of 10 students each from UR. The mean height of one sample might be 68 inches, and the mean of the other might be 69 inches. This difference is due to sampling error — even though both samples come from the same population, random chance leads to different results.
Final Words
Sample statistics are crucial tools in statistics that allow us to summarize data and make estimates about population parameters. They are derived from samples, and their properties, such as bias and standard error, play a significant role in their accuracy and reliability.
While sample statistics are random variables that vary from one sample to another, understanding their characteristics helps us make informed decisions and conclusions in data analysis.
As a result, sample statistics form the backbone of much of statistical inference, providing valuable insights into populations from which we can make predictions and decisions based on limited data.


