Table of contents
Estimated reading time: 7 minutes
What Does y=f(x) Mean, and How to Use It?
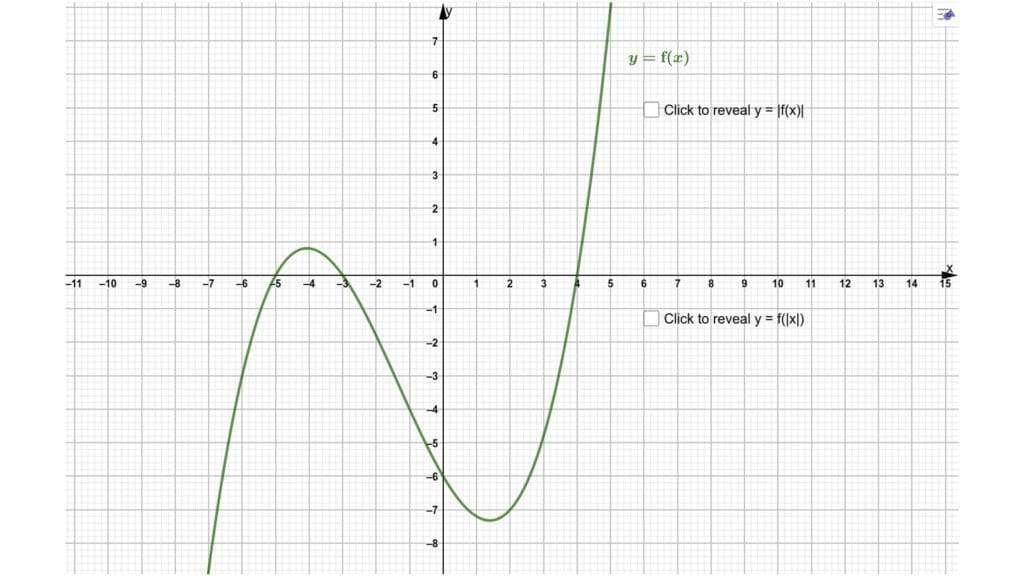
The expression y=f(x) represents a mathematical relationship between two variables, ( y ) and ( x ). This seemingly simple equation, however, unveils a profound concept that plays a pivotal role in various fields, especially within the framework of cause and effect 6 Sigma.
- ( y ) is the dependent variable, meaning its value depends on the value of ( x ).
- ( x ) is the independent variable, which is the variable you can choose or manipulate.
The function ( f ) describes how the value of ( y ) is determined by the value of ( x ). It essentially maps values of ( x ) to corresponding values of ( y ). The relationship can be expressed through various mathematical functions, and the specific form of ( f ) depends on the nature of the relationship between ( y ) and ( x ). For example, ( f(x) ) could represent a linear function, quadratic function, trigonometric function, exponential function, or any other type of mathematical relationship.

DMAIC Process
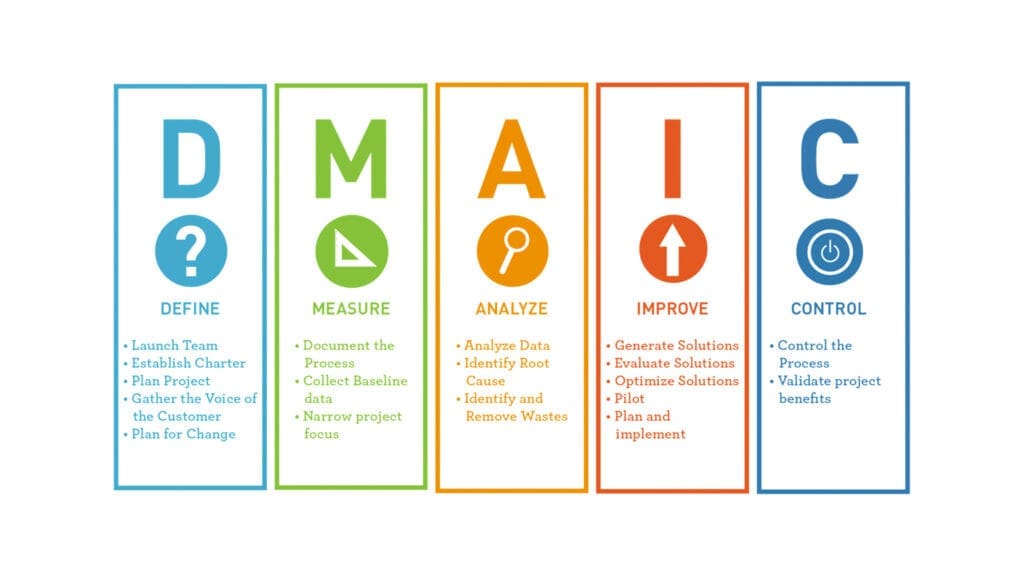
DMAIC stands for Define, Measure, Analyze, Improve, and Control. It is a systematic and data-driven approach used in Six Sigma and other process improvement methodologies. Each phase of DMAIC represents a step in the process improvement cycle:
- Define: In this phase, the project goals and objectives are clearly defined. The scope of the project, the process to be improved, and the problem to be addressed are identified. Stakeholders’ requirements and expectations are also considered.
- Measure: The second phase involves measuring the current process performance. This includes collecting relevant data to quantify the problem and establish a baseline. Measurement systems are validated, and key metrics are identified to assess the process.
- Analyze: In this phase, the collected data is analyzed to identify the root causes of the problem. Various statistical and analytical tools are used to understand the factors influencing the process performance. The goal is to gain insights into what is causing the issues.
- Improve: Based on the analysis, potential solutions and improvements are identified. These improvements are implemented, and the process is modified accordingly. The focus is on addressing the root causes identified in the analysis phase.
- Control: The final phase involves putting controls in place to ensure that the improvements are sustained over time. This includes developing a monitoring and control plan to track key performance indicators and implementing measures to prevent the recurrence of the problem.
DMAIC is a continuous improvement methodology, and the process can be revisited iteratively to further enhance and optimize the process. It is widely used in industries to enhance efficiency, reduce defects, and improve overall quality.

How do the DMAIC process and Y=f(x) work together?
DMAIC can be used to identify cause and effect in a Six Sigma process input variables and process outcomes. The two together can make a powerful partnership. How does each of the DMAIC words work towards Y=f(x), then?
- Define describes how to understand the outcome Y and how to measure it.
- Measure allows you to prioritize the potential x’s, and measure the x and Y.
- Analyze allows you to verify the relationship between x, and Y and determine the most important x.
- Improve aims to implement fixes to help Y and address x.
- Control monitors x and y over time.

Y=f(x) – Define the Y
Determine whether the project has a defined business problem, process problem, or cause and effect in Six Sigma projects. This may be clear at times, but not always. If this is the case, you can get a clear understanding of the Y, such as the process problem in quantifiable terms within the context of project goals.
The project charter defines the problem that the project is designed to solve. To measure the progress of the project, you will need to establish the baseline for the project metrics. It is helpful to get data from customers.
The business plan will place the Y in the context of the overall organizational strategy, financial targets, customer fulfillment, and other relevant goals. The defined phase of the process is completed once these goals have been identified.
Y=f(x) – Measure the Xs
Map your process. This will allow you to determine the causes and effects of any Xs in your formula in 6 Sigma. You will see which Xs have the most influence on Y. Prioritization will be required to reduce the number of Xs.
Data will not help to reduce potential Xs, since the project is still in its beginning stages. To determine what is most important, brainstorming is necessary. Next, you will need to identify patterns that can be used to establish a baseline capability for the project.
Analyze to find the most important Xs
Verify and quantify the X/Y relationship. This phase can be completed using statistical and graphical tools. This is where the equation is very powerful. Now that we know the Y(s) and the Xs, it is time to use qualitative tools (like the FMEA) and Quantitative tools (like hypothesis testing) to determine the function (or “f”) in the equation Y=f(x). This will help you understand which x’s are most important to solving the problem Y. Cause and effect 6 Sigma
Improve and Optimize the Important Xs
What can you do to improve on what you have at this stage? You can do this by brainstorming ideas and coming up with creative solutions. You will need to reduce the number of solutions that you have come up with and focus only on those that are truly necessary.
You will need to rate each solution using criteria, such as how it improves Y or how it addresses x. There are also other criteria that you can use such as ease, cost, and so on. The best way to reduce this number is to determine the likelihood of these solutions failing and how to avoid them.
Benefits of Attending to Y=f(x)
Attending to the relationship ( y = f(x) ) and understanding its implications in various contexts can offer several benefits. Here are some of the advantages:
- Predictive Modeling: The equation ( y = f(x) ) represents a functional relationship between variables. Understanding this relationship allows for predictive modeling. By knowing how changes in ( x ) influence ( y ), you can make predictions about the outcome given certain input conditions.
- Process Optimization: In industrial and business contexts, ( y = f(x) ) might represent a process. Analyzing and understanding this relationship can lead to process optimization. By manipulating key input variables (( x )), you can optimize the desired output (( y )).
- Problem Solving: When faced with a problem or a challenge, understanding the functional relationship ( y = f(x) ) can help identify the root causes. Analyzing how changes in ( x ) impact ( y ) can guide problem-solving efforts.
- Decision Making: In decision-making processes, having a clear understanding of the relationship ( y = f(x) ) allows for more informed decisions. You can evaluate the potential outcomes of different choices based on the known functional relationship.
- Scientific Understanding: In scientific research, many phenomena are described by mathematical relationships. ( y = f(x) ) allows scientists to express and understand these relationships, enabling the development of theories and models.
- Quality Improvement: In quality management and Six Sigma methodologies, ( y = f(x) ) is used to understand and improve processes. By identifying critical input variables (( x )), organizations can enhance the quality of their products or services.
- Data Analysis: ( y = f(x) ) is fundamental in data analysis. Statistical techniques and machine learning algorithms often involve identifying and modeling the relationship between input and output variables.
- Efficiency and Effectiveness: Understanding the functional relationship helps in designing systems and processes that are more efficient and effective. It allows for targeted interventions to improve efficiency and achieve desired outcomes.
- Innovation: In innovation and product development, ( y = f(x) ) guides the design process. Engineers and designers use this relationship to optimize products and create innovative solutions.
- Continuous Improvement: By continuously monitoring and analyzing the relationship ( y = f(x) ), organizations can engage in ongoing improvement efforts. This aligns with the principles of continuous improvement found in methodologies like DMAIC (Define, Measure, Analyze, Improve, Control).
In summary, attending to the relationship ( y = f(x) ) provides a framework for understanding, modeling, and optimizing various processes and systems, leading to improved decision-making, problem-solving, and overall efficiency.


