
Process capability measures how well a process performs within its specification limits. It is expressed using four indices: Cp, Cpk, Pp, and Ppk. Cp measures potential capability assuming perfect centering. Cpk measures actual capability accounting for how centered the process is. Pp and Ppk do the same but use overall standard deviation instead of within-subgroup standard deviation. A Cpk or Ppk of 1.33 or above is the widely cited minimum acceptable standard. A Cpk of 2.0 corresponds to Six Sigma quality.
Table of contents
Key Takeaways
- Process capability measures whether a process can consistently meet customer specification limits. A process can be precise or accurate — capability measures both together.
- Four indices describe capability: Cp, Cpk, Pp, and Ppk. Cp and Cpk use within-subgroup standard deviation. Pp and Ppk use overall standard deviation.
- Cp measures spread only. It assumes the process is perfectly centered between USL and LSL. It does not account for off-centering.
- Cpk measures spread and centering together. When the process mean drifts toward one specification limit, Cpk drops below Cp.
- Cpk equals Cp only when the process is perfectly centered. Any off-centering makes Cpk lower than Cp.
- Industry benchmark: Cpk of 1.33 is the widely cited minimum acceptable standard. Six Sigma targets a Cpk of 2.0 (equivalent to 3.4 DPMO after a 1.5σ shift).
- Use Cpk for stable, in-control processes. Use Ppk for new, unstable, or pre-production processes.
- Capability analysis sits in the Measure and Control phases of DMAIC. It establishes baseline performance in Measure and confirms sustained improvement in Control.
- You must verify process stability before running capability analysis. Capability results are meaningless on an unstable process.
What Is Process Capability?
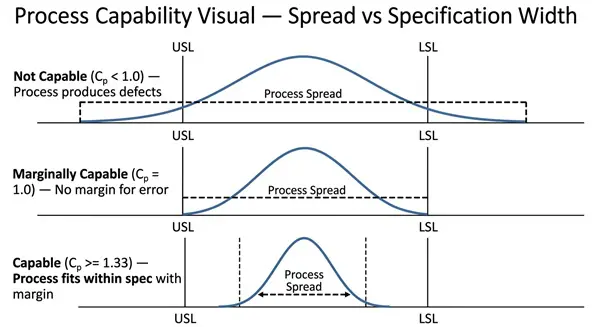
Process capability tells you whether a process can reliably produce output within its customer-defined limits.
The customer defines the acceptable range through two limits. The Upper Specification Limit (USL) is the highest acceptable value. The Lower Specification Limit (LSL) is the lowest acceptable value.
Capability analysis compares the actual behavior of the process to those limits. If the process spread fits comfortably within the spec limits, the process is capable. If the spread reaches or exceeds the limits, the process produces defects.
The Four Capability Indices: Cp, Cpk, Pp, and Ppk
iSixSigma defines the four indices in precise terms:
- Cp: Process Capability. A simple indicator of process capability.
- Cpk: Process Capability Index. Adjustment of Cp for the effect of non-centered distribution.
- Pp: Process Performance. A straightforward indicator of process performance.
- Ppk: Process Performance Index. Adjustment of Pp for the effect of non-centered distribution.

Public, Onsite, Virtual, and Online Six Sigma Certification Training!
- We are accredited by the IASSC.
- Live Public Training at 52 Sites.
- Live Virtual Training.
- Onsite Training (at your organization).
- Interactive Online (self-paced) training,
Cp: Potential Capability
What Cp measures: The ratio of the specification width to the actual process spread. It tells you whether the process could fit within the specification limits if it were perfectly centered.
Formula:
Cp = (USL minus LSL) divided by (6 × σ within)
Where σ within is the within-subgroup standard deviation (estimated from a control chart using R-bar/d2 or S-bar/c4).
Cp interpretation:
| Cp Value | What It Means |
| Less than 1.00 | Process spread wider than spec limits. Defects are inevitable. |
| Equal to 1.00 | Process spread exactly equals spec width. No margin for error. |
| 1.00 to 1.33 | Process is marginally capable. Small shifts will cause defects. |
| 1.33 or above | Process spread fits within spec with margin. Generally acceptable. |
| 2.00 or above | Six Sigma quality level. Process spread uses only 50% of spec width. |
Limitation of Cp: It does not tell you where the process mean sits. A process with Cp = 2.0 can still produce defects if the mean sits near one specification limit.
Cpk: Actual Capability With Centering

What Cpk measures: The actual capability of the process, accounting for both variation and how well the process is centered within the specification limits.
Formula:
Cpk = minimum of:
- (USL minus X̄) divided by (3 × σ within)
- (X̄ minus LSL) divided by (3 × σ within)
Where X̄ is the process mean and σ within is the within-subgroup standard deviation.
The relationship between Cp and Cpk:
Cpk equals Cp only when the process mean is exactly centered between USL and LSL. Any off-centering reduces Cpk below Cp.
Six Sigma Study Guide states: “Cp and Cpk are related in that Cpk will always be equal to or less than Cp. When Cpk equals Cp, the process is perfectly centered between the specification limits.” (Source: Six Sigma Study Guide, March 2026)
Cpk benchmark values:
| Cpk Value | Industry Interpretation |
| Less than 1.00 | Not capable. Producing defects. |
| 1.00 to 1.33 | Marginally capable. Monitor closely. |
| 1.33 | Widely cited minimum acceptable standard. |
| 1.50 | Six Sigma philosophy minimum for acceptable process. |
| 1.67 | Used in automotive and other critical industries as the target. |
| 2.00 | Six Sigma quality. 3.4 DPMO after 1.5σ shift. |
Pp and Ppk: Process Performance Indices
Pp and Ppk use the same formulas as Cp and Cpk, but substitute overall standard deviation for within-subgroup standard deviation.
Pp formula:
Pp = (USL minus LSL) divided by (6 × σ overall)
Ppk formula:
Ppk = minimum of:
- (USL minus X̄) divided by (3 × σ overall)
- (X̄ minus LSL) divided by (3 × σ overall)
Also Read: What Is Process Tolerance? Definition, Limits, Capability Indices, and Six Sigma
Cpk vs Ppk: When to Use Each
This is one of the most common sources of confusion in capability analysis. The distinction matters because they measure different things.
| Feature | Cpk | Ppk |
| Standard deviation used | Within-subgroup (short-term) | Overall (long-term) |
| What it measures | Potential capability under controlled conditions | Actual real-world performance |
| When to use | Process is stable and in statistical control | Process is new, unstable, or pre-production |
| Typical result | Higher value | Lower value (more variation captured) |
| Used for | Confirming improvement after DMAIC | Baseline study before improvement |
Why Process Stability Must Come First
Capability indices are only valid for stable processes.
You verify stability using a control chart in Minitab or equivalent software. If the control chart shows special cause variation (points outside control limits, runs, trends), fix the process first. Then run capability analysis on the stable version.
Running capability on an unstable process produces a number that looks like capability but predicts nothing. It is one of the most common mistakes in Six Sigma project work.
Capability Analysis in DMAIC: Phase by Phase
Capability analysis appears in two DMAIC phases.
Measure Phase
You run a baseline capability study here. This uses Pp and Ppk because the process has likely not been fully characterized or stabilized yet.
The baseline Ppk documents current process performance. It quantifies the gap between current capability and the target. This gap drives the business case for the project.
Control Phase
After implementing improvements in the Improve phase, you run a post-improvement capability study. The process should now be stable. Use Cpk.
Compare the post-improvement Cpk to the baseline Ppk. Document the improvement in capability. Confirm the process now meets the customer specification.
This comparison is the quantitative proof that your DMAIC project delivered results.
Also Read: Capability Maturity Model Integration (CMMI)
Worked Example: Capability Analysis in a Machining Process
A Green Belt is studying a CNC milling process. The part dimension specification is 50.0 mm ± 0.5 mm.
USL = 50.5 mm LSL = 49.5 mm Spec width = 1.0 mm
Baseline data (Measure phase):
The team collects 100 measurements. Process mean X̄ = 50.2 mm. Overall standard deviation σ = 0.22 mm.
Pp = (50.5 minus 49.5) divided by (6 × 0.22) = 1.0 divided by 1.32 = 0.76
Pp = 0.76. The process is not capable. The spread exceeds the spec width.
The mean of 50.2 also sits above the target center of 50.0 mm.
Ppk = minimum of:
- (50.5 minus 50.2) divided by (3 × 0.22) = 0.3 divided by 0.66 = 0.45
- (50.2 minus 49.5) divided by (3 × 0.22) = 0.7 divided by 0.66 = 1.06
Ppk = 0.45. The process is not capable and is significantly off-center toward the USL.
Post-improvement data (Control phase):
The team adjusts the machine setup and reduces variation. The process stabilizes. New data: mean X̄ = 50.0 mm, within-subgroup σ = 0.12 mm.
Cpk = minimum of:
- (50.5 minus 50.0) divided by (3 × 0.12) = 0.5 divided by 0.36 = 1.39
- (50.0 minus 49.5) divided by (3 × 0.12) = 0.5 divided by 0.36 = 1.39
Cpk = 1.39. The process is now capable. It exceeds the 1.33 minimum benchmark. The process mean is centered.
The team documents the improvement: Ppk from 0.45 to Cpk of 1.39.
FAQs on Process Capability
1. What is the minimum acceptable Cpk value?
A Cpk of 1.33 is the widely accepted minimum standard across most industries. Some sectors like automotive set a higher bar at 1.67, while Six Sigma quality targets 2.0.
2. What is the difference between Cpk and Ppk?
Cpk uses within-subgroup standard deviation and reflects short-term process potential under stable conditions. Ppk uses overall standard deviation and captures real-world long-term performance. Cpk is typically the higher value of the two.
3. When should I use Cpk versus Ppk?
Use Ppk when studying a new, unstable, or pre-production process — such as during the Measure phase of a DMAIC project. Switch to Cpk once the process is stable and in statistical control, typically in the Control phase after improvements are made.
4. Why does Cpk matter more than Cp?
Cp only measures whether the process spread fits within spec limits, assuming perfect centering. Cpk also accounts for where the process mean actually sits. A process with a high Cp can still produce defects if the mean drifts toward one specification limit — Cpk catches this, Cp does not.
5. Do I need to check process stability before running a capability study?
Yes, always. Running capability analysis on an unstable process produces results that look meaningful but predict nothing. Verify stability using a control chart first. If special cause variation exists, fix the process before calculating any capability index.
How SSDSI Teaches Process Capability
At Six Sigma Development Solutions Inc., we teach process capability analysis in both our Green Belt and Black Belt programs.
At Green Belt level, we cover Cp, Cpk, Pp, and Ppk formulas, interpretation, benchmark values, and how to run a capability study in Minitab. Students learn how to verify process stability before running capability analysis and how to document baseline and post-improvement results.
At Black Belt level, we add non-normal capability analysis, capability for attribute data, and the connection between capability indices and sigma level.
We deliver training in three formats. Onsite training brings instructors to your facility. Live virtual training delivers the same instructor-led content in real time online. Online self-paced training lets you work through the content on your own schedule.
Every format prepares you for the IASSC certification exam. SSDSI is an IASSC Accredited Training Organization.
Ready to master process capability and the full Measure phase toolkit?
Explore SSDSI’s Green Belt and Black Belt programs in onsite, live virtual, or online formats.
About Six Sigma Development Solutions, Inc.
Six Sigma Development Solutions, Inc. offers onsite, public, and virtual Lean Six Sigma certification training. We are an Accredited Training Organization by the IASSC (International Association of Six Sigma Certification). We offer Lean Six Sigma Green Belt, Black Belt, and Yellow Belt, as well as LEAN certifications.
Book a Call and Let us know how we can help meet your training needs.


