Table of contents
Estimated reading time: 7 minutes
What Is Range as a Measure of Dispersion?
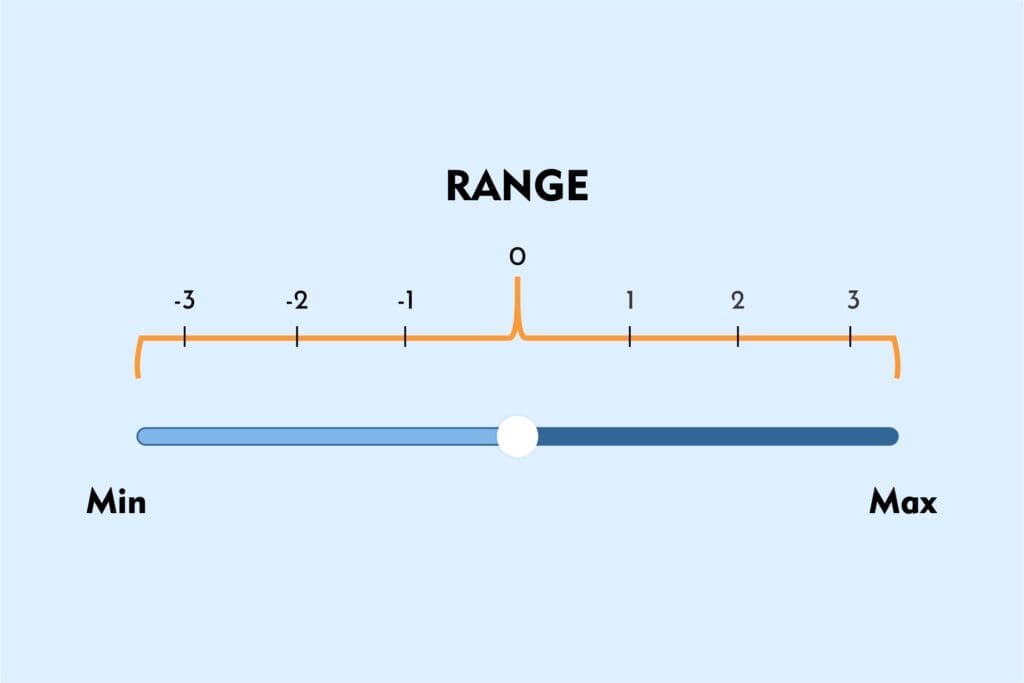
Range is a measure of dispersion that quantifies the spread or variability of a set of values. To find the range, it is calculated as the difference between the maximum and minimum values in a dataset. The range provides a simple and easy-to-understand way to assess the spread of data, but it can be sensitive to extreme values and may not be a robust measure in the presence of outliers.

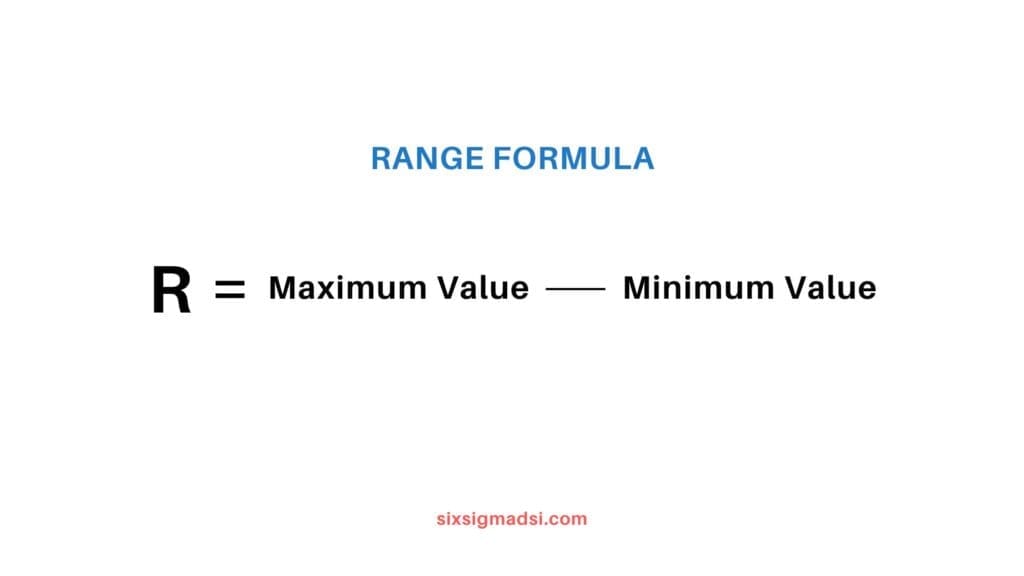
The formula for calculating the range (R) is:
R = Maximum Value – Minimum Value
It’s worth noting that while the range is easy to calculate and understand, it has limitations. It is highly influenced by extreme values, making it sensitive to outliers. For a more robust measure of dispersion, other statistical measures like the interquartile range (IQR) or standard deviation are often preferred in certain situations. These measures provide a better representation of the spread of values, especially when dealing with datasets that may contain outliers.
How to Find Range: Step-by-Step Guide
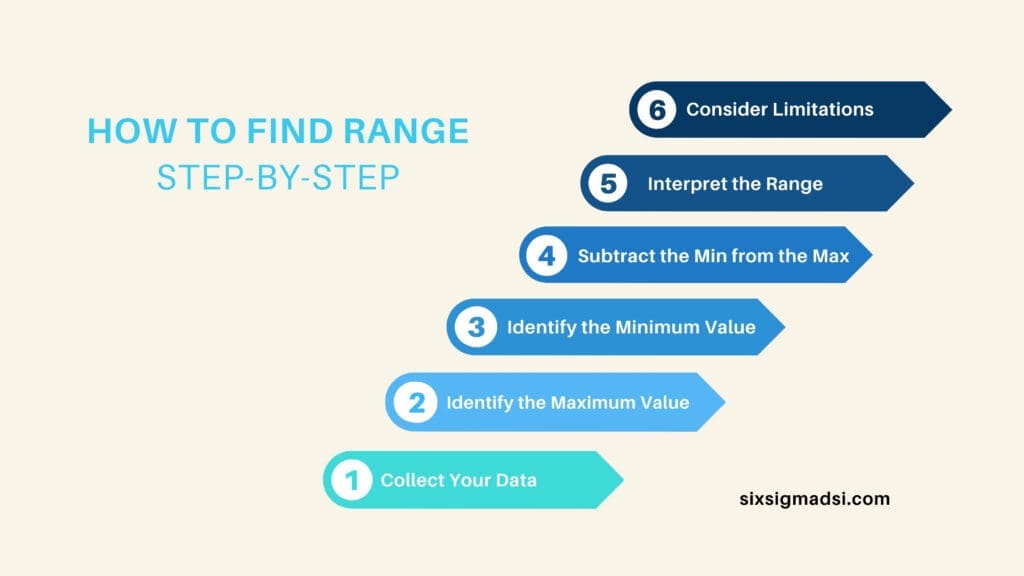
Understanding the range of a dataset is crucial in assessing variability and dispersion. In this guide, we will walk you through the steps to find the range using a small example dataset of exam scores: 78, 85, 92, 68, 95, 89, 77.
Step 1: Collect Your Data
Gather the dataset for which you want to find the range. For example, let’s use the following set of exam scores: 78, 85, 92, 68, 95, 89, 77.
Step 2: Identify the Maximum Value
Locate the highest value in your dataset. In our example, the maximum score is 95.
Step 3: Identify the Minimum Value
Identify the lowest value in your dataset. In our example, the minimum score is 68.
Step 4: Subtract the Minimum from the Maximum
Calculate the it by subtracting the minimum value from the maximum value. In the example: Range=Maximum−Minimum=95−68=27.Range=Maximum−Minimum=95−68=27.
Step 5: Interpret the Range
Understand that the range represents the spread or variability in your dataset. A larger range indicates greater variability, suggesting a wider distribution of values, while a smaller range implies less dispersion, with values closer together.
Step 6: Consider Limitations
Be aware that the range has limitations. It only considers the extreme values (maximum and minimum) and doesn’t account for the distribution or frequency of values between them. In some cases, using more advanced measures like variance or standard deviation may be necessary for a more detailed analysis.
Step 7: Apply to Real-World Scenarios
Apply your understanding of the range to real-world situations. Consider how analyzing the range can be valuable in various fields such as finance, biology, or education to assess variability and make informed decisions.

Advantages of Using Range as a Measure of Dispersion
While the range has its limitations, it also has some advantages as a measure of dispersion:
- Simplicity:
The range is straightforward to understand, making it accessible to a wide audience, including those without a strong statistical background. Its simplicity allows for quick calculations and easy communication of the spread of data. - Ease of Computation:
Calculating it involves only finding the difference between the maximum and minimum values in a dataset. This simplicity makes it a quick and computationally inexpensive measure of dispersion. - Intuitive Interpretation:
The concept of the range is intuitive – it represents the extent or spread of the data. A larger range implies greater variability, while a smaller range suggests less variability. This intuitive interpretation makes it a useful tool for a preliminary assessment of data variability. - Useful for Exploratory Data Analysis:
In exploratory data analysis, especially when initially exploring a dataset, the range can provide a quick summary of the overall spread of values. It can help identify the general scale and variability of the data. - Effective for Small Datasets:
In situations where the dataset is small and more sophisticated measures of dispersion may not be applicable or may not provide meaningful insights, the range can still offer a basic understanding of the data spread.
Despite these advantages, it’s essential to be aware of its limitations, particularly its sensitivity to outliers. For datasets with extreme values, the range may not accurately represent the central tendency and spread of the majority of the data. In such cases, other measures of dispersion, like the interquartile range (IQR) or standard deviation, may be more appropriate.

Limitations of Using Range as a Measure of Dispersion
While the range is a simple and easily understandable measure of dispersion, it comes with several limitations that can affect its accuracy and usefulness in certain situations:
- Sensitivity to Outliers:
The range is highly sensitive to extreme values or outliers in a dataset. Since it depends only on the maximum and minimum values, a single extreme value can significantly distort the measure of dispersion, making it an unreliable indicator in the presence of outliers. - Does Not Reflect the Entire Dataset:
The range only considers the extreme values (maximum and minimum) and does not take into account the distribution of values between these extremes. It may not provide a complete picture of the variability within the dataset, especially if there is clustering or skewness in the data. - Sample Size Impact:
The range does not account for the size of the dataset. Two datasets with the same range may have different levels of variability if one dataset is larger than the other. Therefore, it doesn’t provide a standardized measure of dispersion that can be easily compared across datasets of different sizes. - Not Robust:
The range is not a robust measure of dispersion. Robustness refers to the ability of a statistic to resist the influence of extreme values. Since the range is directly affected by outliers, it may not accurately represent the central tendency and spread of the majority of the data. - Limited Statistical Properties:
The range lacks certain statistical properties that make other measures of dispersion, such as the standard deviation or interquartile range, more desirable in certain contexts. For example, the range is not used in the calculation of other statistical parameters, and it does not have desirable mathematical properties for statistical inference. - Ignores Data Distribution:
The range provides no information about the distribution of values within the dataset. It treats all values equally and does not distinguish between different patterns of variability, such as whether the variability is concentrated in the center or spread throughout the dataset.
Given these limitations, the range is often considered a basic and preliminary measure of dispersion. In situations where a more robust and informative measure is required, other statistical measures like the interquartile range (IQR) or standard deviation are often preferred.

About Six Sigma Development Solutions, Inc.
Six Sigma Development Solutions, Inc. offers onsite, public, and virtual Lean Six Sigma certification training. We are an Accredited Training Organization by the IASSC (International Association of Six Sigma Certification). We offer Lean Six Sigma Green Belt, Black Belt, and Yellow Belt, as well as LEAN certifications.
Book a Call and Let us know how we can help meet your training needs.


