
Dispersion is how spread out a set of data points is around its central value, and it’s one of the two most important things to know about any data set, alongside the average itself. It matters because two processes can have the exact same average and still behave completely differently: one tightly clustered around the target, the other swinging wildly on either side of it. Six Sigma is fundamentally about reducing that spread, so measuring it accurately comes first.
The common measures are range (simplest, most sensitive to outliers), variance and standard deviation (the standard, most widely used pair), interquartile range (best for skewed data or data with outliers), and coefficient of variation (the only one that lets you fairly compare variability across data sets measured in different units).
Quick Reference Table
| Measure | What It Captures | Best Used When |
| Range | Difference between the highest and lowest value | A quick, rough sense of spread is enough |
| Variance | Average squared distance from the mean | An intermediate step toward standard deviation |
| Standard Deviation | Typical distance from the mean, in the data’s original units | The standard, default measure for most Six Sigma work |
| Interquartile Range (IQR) | Spread of the middle 50% of the data | The data is skewed or has significant outliers |
| Coefficient of Variation (CV) | Standard deviation relative to the mean, as a percentage | Comparing variability across different units or scales |
Table of contents
Key Takeaways
- Dispersion measures how spread out data is; central tendency (mean, median) measures where it’s centered. Both are needed to understand a data set; neither alone tells the full story.
- Two data sets can share the same average and still have very different dispersion. This is exactly why Six Sigma treats reducing variation as a distinct, primary goal, separate from simply hitting a target average.
- Range is the simplest measure, but the most sensitive to a single outlier. A single extreme value can make a process look far more variable than it typically is.
- Standard deviation is the default, most widely used measure in Six Sigma work, since it’s expressed in the data’s original units and forms the basis of control charts and capability analysis.
- Interquartile range is the better choice for skewed data or data with real outliers, since it describes the middle 50% of the data without being distorted by extreme values.
- Absolute measures (range, standard deviation, IQR) can’t fairly compare data sets in different units. The coefficient of variation solves this by expressing spread relative to the mean, as a percentage, letting you compare, for example, variability in weight against variability in time.
- “Dispersion” has other legitimate meanings outside statistics (wave physics, optics, materials science), but for a Six Sigma audience, the statistical measures above are almost always the relevant ones.
What Is Statistical Dispersion?
Dispersion describes how spread out or scattered a set of data points is around its central value (the mean or median). It’s one of the two essential things to know about any data set: where it’s centered (central tendency) and how spread out it is (dispersion). Knowing only the average of a process tells you almost nothing about how consistently that process actually performs.
This distinction sits at the core of why Six Sigma exists as a methodology in the first place. A process might hit its target average perfectly while still producing wildly inconsistent individual results, some units far above spec, others far below, simply canceling out in the average. Reducing dispersion, not just hitting the right average, is the entire point of a Six Sigma improvement effort.

Public, Onsite, Virtual, and Online Six Sigma Certification Training!
- We are accredited by the IASSC.
- Live Public Training at 52 Sites.
- Live Virtual Training.
- Onsite Training (at your organization).
- Interactive Online (self-paced) training,
Why Does Dispersion Matter in Six Sigma?
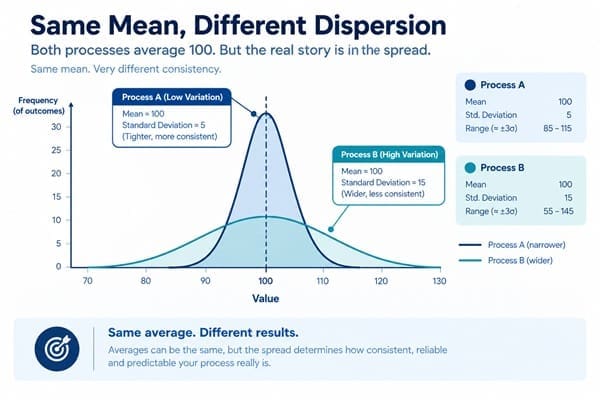
Consider two production lines that both average exactly 100 grams per unit. Line A consistently produces units between 98 and 102 grams. Line B produces units ranging from 70 to 130 grams, still averaging 100 overall, but with dramatically more variation. Any customer receiving a unit from Line B faces a much higher chance of getting something well outside acceptable limits, even though both lines report an identical average.
This is exactly why dispersion measures feed directly into core Six Sigma tools: control charts plot data against limits built from standard deviation, and process capability indices (Cp, Cpk) explicitly compare the spread of a process against its specification limits. Without an accurate dispersion measure, none of these tools can function correctly.
The Measures of Dispersion, Compared
Range
The range is the simplest possible measure: the highest value in a data set minus the lowest. It’s fast to calculate and easy to explain, but it’s also the most sensitive to a single outlier, one unusually extreme value can make an otherwise consistent process look far more variable than it typically is. SSDSI’s own Range as a Measure of Dispersion content covers this specific measure and its use in control charts in full depth.
Variance and Standard Deviation
Variance is the average of the squared distances between each data point and the mean. Standard deviation is simply the square root of variance, which brings the measure back into the data’s original units, making it far easier to interpret directly. Standard deviation is the default, most widely used dispersion measure in Six Sigma work, forming the statistical basis for control chart limits and capability analysis. SSDSI’s own Standard Deviation as a Measure of Dispersion content covers this measure’s calculation and application in detail.
Interquartile Range (IQR)
The interquartile range is the difference between the 75th percentile (Q3) and the 25th percentile (Q1) of a data set, capturing the spread of the middle 50% of the data while ignoring extreme values entirely. This makes IQR the better choice specifically when a data set is skewed or contains genuine outliers that would otherwise distort a range or standard deviation calculation.
Absolute vs. Relative Measures of Dispersion
Range, standard deviation, and IQR share an important limitation: they’re all absolute measures, expressed in the same units as the original data. This creates a real problem when comparing variability across two data sets measured in different units, you can’t directly compare the “spread” of a weight measurement (in grams) against the “spread” of a time measurement (in seconds).
Relative measures of dispersion solve this by expressing spread as a ratio or percentage rather than a raw unit value, making cross-comparison possible.
Coefficient of Variation: Comparing Apples to Oranges
The Coefficient of Variation (CV) is the most commonly used relative measure of dispersion, calculated as the standard deviation divided by the mean, typically expressed as a percentage:
CV = (Standard Deviation ÷ Mean) × 100%
This is genuinely useful, practical content most single-measure glossary pages skip entirely. Because CV strips out the original units, it lets a Six Sigma team directly compare the variability of two completely different measurements, say, comparing how consistent a process’s cycle time is against how consistent its material cost is, on the same relative scale.
This matters specifically in the Measure and Analyze phases of DMAIC, where teams routinely work with several different types of data measured in different units, and need a fair way to determine which one is genuinely the most variable relative to its own average, not just which one has the largest raw numbers.
How Do You Choose the Right Measure of Dispersion?
1. Start With Standard Deviation as Your Default
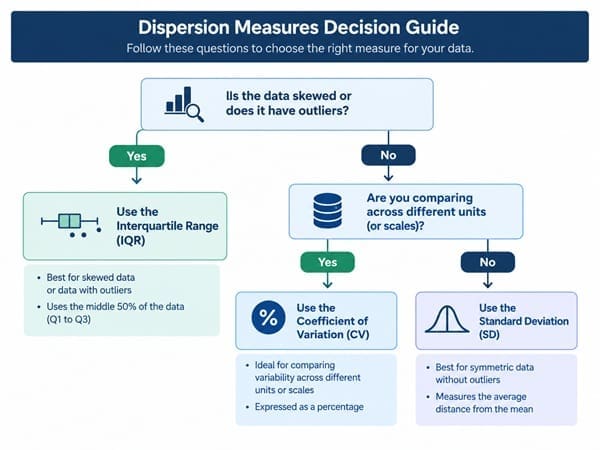
For most Six Sigma work involving roughly normal, non-skewed data, standard deviation is the standard choice, and it’s what most downstream tools (control charts, capability indices) are already built around.
2. Switch to Interquartile Range If the Data Is Skewed or Has Outliers
If a histogram or dot plot reveals a lopsided distribution or a few extreme values, IQR gives a more honest picture of the data’s typical spread than standard deviation would.
3. Use Range Only for a Quick, Rough Check
Range is useful as a fast, simple gut-check, particularly in smaller data sets, but it shouldn’t be the primary measure reported in a formal analysis given its sensitivity to outliers.
4. Use Coefficient of Variation When Comparing Across Units
Whenever the real question is “which of these different measurements is more variable relative to its own scale,” not just “which has bigger raw numbers,” CV is the measure built for that specific comparison.
Example
Problem: A Six Sigma team is comparing the consistency of two process inputs: raw material weight (measured in kilograms) and cycle time (measured in minutes), to decide which one deserves priority attention in the Improve phase.
Analysis: Comparing the raw standard deviations directly is meaningless, since kilograms and minutes aren’t comparable units. The team calculates the coefficient of variation for each: material weight has a CV of 4%, while cycle time has a CV of 11%.
Six Sigma approach: Despite cycle time’s raw standard deviation looking smaller in absolute terms, its CV reveals it’s actually far more variable relative to its own average than material weight is.
Action: The team prioritizes cycle time variation for the Improve phase, a conclusion the raw, absolute dispersion numbers alone would not have clearly supported.
Result (hypothetical): Using the coefficient of variation instead of comparing raw standard deviations directly prevents the team from focusing improvement effort on the wrong input. This is a hypothetical illustration of choosing the right dispersion measure, not a documented case study.
Dispersion Outside of Statistics
The word “dispersion” has other legitimate technical meanings in fields unrelated to Six Sigma, and it’s worth being clear about them briefly, since the term is genuinely shared rather than misused.
- Wave physics: dispersion describes how different wavelengths of a wave (light, sound, water) travel at different speeds, causing the wave to spread out. This is what causes a prism to separate white light into a rainbow.
- Optics (chromatic dispersion): a specific case of wave dispersion involving the separation of light into its component colors as it passes through a lens or prism.
- Materials science: dispersion refers to how evenly nanoparticles or fine particles are distributed within a matrix material, relevant to composites and nanotechnology.
These meanings are unrelated to Six Sigma’s use of the term. If you’re researching process variation, quality data, or DMAIC analysis, the statistical measures covered above are what you’re looking for; if you’re researching optics or materials science, those fields’ own specialized literature is the better resource.
Common Mistakes When Working With Dispersion
- Reporting only the mean, without any dispersion measure at all. Two processes with identical averages can have completely different real-world performance; the mean alone never tells the full story.
- Using range on a data set with a clear outlier. A single extreme value can make an otherwise consistent process look dramatically more variable than it typically is.
- Comparing raw standard deviations across different units. Without converting to a relative measure like the coefficient of variation, this comparison is statistically meaningless.
- Defaulting to standard deviation on clearly skewed data. When a distribution is lopsided, IQR gives a more honest, less distorted picture of typical spread.
- Treating “low dispersion” as automatically good without checking the target. A tightly clustered process that’s consistently off-target still has a real problem; dispersion and accuracy to target are separate questions.
Frequently Asked Questions on Dispersion
Q: What is dispersion in statistics?
A: Dispersion is how spread out a set of data points is around its central value (the mean or median). It’s measured using tools like range, variance, standard deviation, interquartile range, and coefficient of variation.
Q: What are the measures of dispersion?
A: The main measures are range (highest minus lowest value), variance and standard deviation (based on distance from the mean), interquartile range (the spread of the middle 50% of data), and coefficient of variation (standard deviation relative to the mean, expressed as a percentage).
Q: What is the difference between absolute and relative measures of dispersion?
A: Absolute measures (range, standard deviation, IQR) are expressed in the data’s original units and can’t be fairly compared across different units. Relative measures (like the coefficient of variation) express spread as a ratio or percentage, making cross-comparison possible.
Q: What is the coefficient of variation used for?
A: It’s used to compare the variability of two or more data sets measured in different units or scales, since it strips out the original units by expressing standard deviation as a percentage of the mean.
Q: When should you use range vs. standard deviation?
A: Range works for a quick, rough sense of spread, especially in small data sets, but it’s highly sensitive to outliers. Standard deviation is the standard, more reliable default for most formal Six Sigma analysis and feeds directly into control charts and capability indices.
Q: What does dispersion mean outside of statistics?
A: In physics, dispersion describes how different wavelengths of a wave travel at different speeds. In optics, chromatic dispersion refers to light separating into colors through a prism or lens. In materials science, it describes how evenly particles are distributed within a material. These meanings are unrelated to Six Sigma’s statistical use of the term.
Final Words
Dispersion answers a question the average alone never can: how consistent is this process really?
Standard deviation remains the default, most useful measure for most Six Sigma work, but knowing when to reach for interquartile range instead (skewed data), or the coefficient of variation (comparing across different units), is what separates a genuinely accurate variation analysis from one that quietly misleads the team pursuing it. Reducing dispersion, not just hitting the right average, is the core work Six Sigma exists to do.
Choosing the right dispersion measure, and knowing when standard deviation isn’t the right tool for the data in front of you, is a foundational Measure-phase skill every Six Sigma practitioner needs.
Six Sigma Development Solutions, Inc. (SSDSI) is IASSC-accredited and 5-star rated on Google Reviews, having certified 5,322+ professionals across 600+ organizations in 52 cities. Our onsite, live virtual, public, and online Green Belt and Black Belt training covers dispersion, control charts, and capability analysis in the depth needed to analyze your data accurately. Explore SSDSI’s Green Belt certification to build that foundation.
About Six Sigma Development Solutions, Inc.
Six Sigma Development Solutions, Inc. offers onsite, public, and virtual Lean Six Sigma certification training. We are an Accredited Training Organization by the IASSC (International Association of Six Sigma Certification). We offer Lean Six Sigma Green Belt, Black Belt, and Yellow Belt, as well as LEAN certifications.
Book a Call and Let us know how we can help meet your training needs.


