Table of contents
Estimated reading time: 8 minutes
Hypothesis Testing Cheat Sheet
In this article, we give you statistics Hypothesis Testing Cheat Sheet rules and steps for understanding examples of the Null Hypothesis and the Alternative Hypothesis of the key hypothesis tests in our Lean Six Sigma Green Belt and Lean Six Sigma Black Belt courses.
You can use hypothesis tests to challenge whether some claim about a population is proven to be statistically true (meaning that the data proves the claim through data). For example, a claim that “site A” in a financial company closes loans faster than “site B”. Another example may be that “shift 1” is performing better than “shift 2”.
If you sometimes wonder why one department is performing better than another? It’s because they could visually see a difference between the two departments. However, when we compared the data from the two departments in a hypothesis test, we discovered that there was no statistically significant difference between the two departments. I have seen people fired for a perceived visual difference when there was no statistically significant difference.
Hypothesis testing rules are a formal statistical technique to decide objectively whether there is a significant statistical difference.
This article is a Hypothesis Testing Cheat Sheet” for those in our Lean Six Sigma Green Belt and Lean Six Six Sigma Green Belt and Black Belt courses to quickly identify the Null Hypothesis and the Alternative Hypothesis for each Hypothesis Test.
Key Concepts
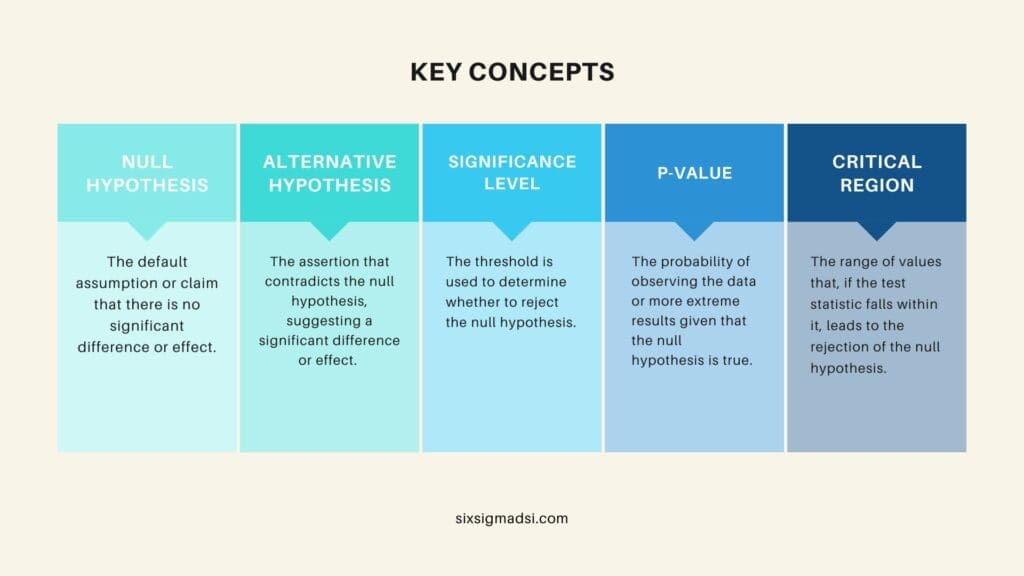
- Null Hypothesis (H₀): The default assumption or claim that there is no significant difference or effect.
- Alternative Hypothesis (H₁ or Hₐ): The assertion that contradicts the null hypothesis, suggesting a significant difference or effect.
- Significance Level (α): The threshold used to determine whether to reject the null hypothesis.
- P-value: The probability of observing the data or more extreme results given that the null hypothesis is true.
- Critical Region: The range of values that, if the test statistic falls within it, leads to the rejection of the null hypothesis.

Hypothesis Testing Steps
Hypothesis testing involves a structured process to make inferences about populations based on sample data. Here are the general steps involved in hypothesis testing:
State the Hypotheses:
- H₀ (Null Hypothesis): There is no effect, no difference, or no relationship.
- H₁ (Alternative Hypothesis): There is an effect, a difference, or a relationship.
Select the Significance Level (α):
- Commonly used levels include 0.05, 0.01, or as specified for the study.
Choose the Appropriate Test:
- Select the statistical test based on data type, sample size, and study design (e.g., t-test, chi-square test, ANOVA, etc.).
Collect Data and Calculate Test Statistic:
- Compute the test statistic relevant to the chosen test using sample data.
Determine the P-value:
- Find the probability of obtaining the observed results or more extreme results under the assumption that the null hypothesis is true.
Compare P-value with α:
- If the p-value is less than or equal to α, reject the null hypothesis.
- If the p-value is greater than α, fail to reject the null hypothesis.
Make a Conclusion:
- If the null hypothesis is rejected, there is sufficient evidence to support the alternative hypothesis.
- If the null hypothesis is not rejected, there is not enough evidence to support the alternative hypothesis.
These hypothesis-testing steps provide a systematic approach to assess hypotheses and draw conclusions based on sample data while considering the potential for errors and ensuring the validity of the statistical analysis.
Types of Errors
In hypothesis testing, two types of errors can occur: Type I errors and Type II errors.
Type I Error (False Positive):
- Definition: Type I error occurs when you reject the null hypothesis when it is true.
- Symbol: Denoted as α (alpha).
- Explanation: This error indicates that you conclude there is a significant effect or difference when, in reality, there is no such effect or difference present in the population.
- Probability: The significance level (α) chosen for the test represents the probability of committing a Type I error. For instance, if you set α = 0.05, it means there’s a 5% chance of wrongly rejecting the null hypothesis.
Type II Error (False Negative):
- Definition: Type II error occurs when you fail to reject the null hypothesis when it is false.
- Symbol: Often denoted as β (beta).
- Explanation: This error suggests that you fail to detect a significant effect or difference when there is indeed one present in the population.
- Probability: The probability of a Type II error is influenced by factors such as sample size, effect size, and the chosen significance level. Unlike α, β is not directly chosen but is related to the power of the statistical test.
- Power of a Test: The power of a statistical test is the probability of correctly rejecting a false null hypothesis. Power = 1 – β. A higher power means a lower chance of making a Type II error.
Summary:
- Type I Error (False Positive): Incorrectly rejecting a true null hypothesis.
- Type II Error (False Negative): Failing to reject a false null hypothesis.
In hypothesis testing, balancing between Type I and Type II errors is crucial. Usually, lowering the probability of one type of error leads to an increase in the probability of the other. Researchers often aim to minimize both types of errors by appropriately selecting sample sizes, using appropriate statistical tests, and understanding the trade-offs between the errors based on the context of the study. These considerations constitute essential hypothesis testing rules for achieving reliable and accurate conclusions.
Common Statistical Tests
- Z-test and t-test: For hypothesis testing involving means.
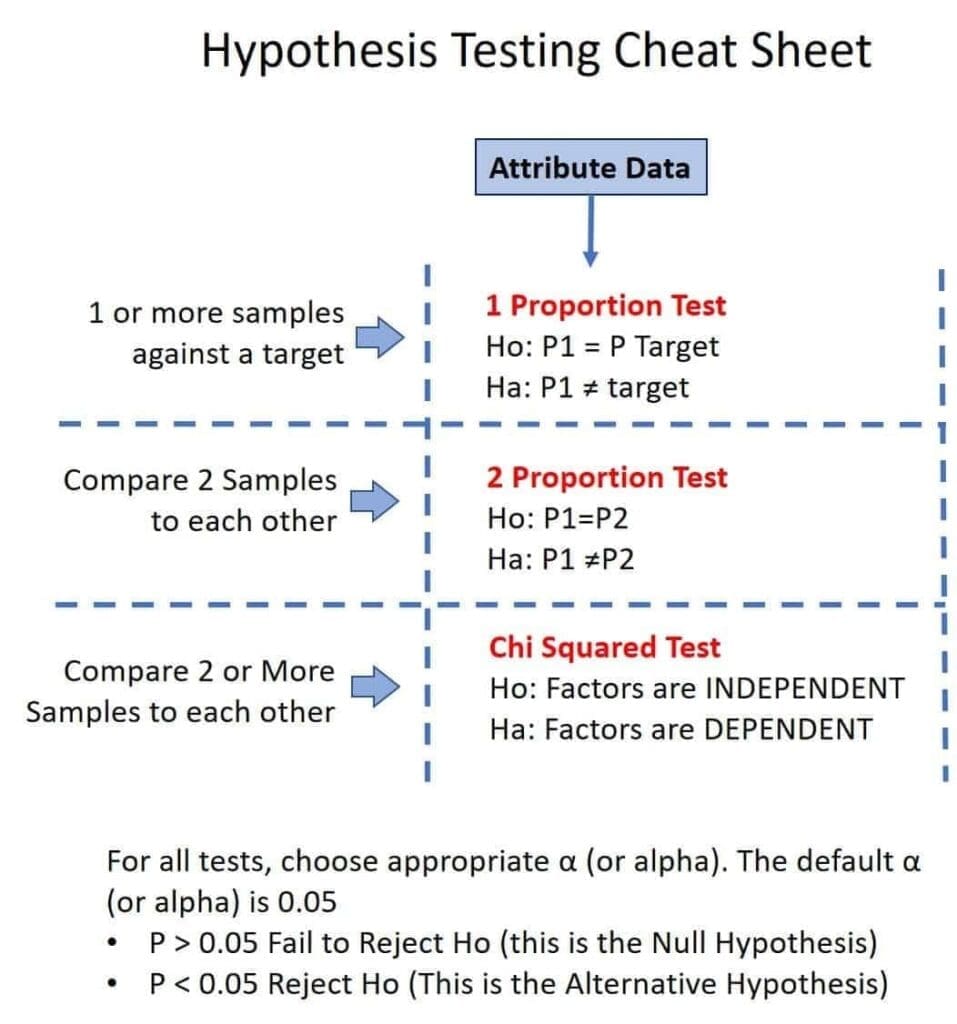
- Chi-square test: For testing relationships between categorical variables.
- ANOVA (Analysis of Variance): For comparing means of three or more groups.
- F-test: For comparing statistical models.
Remember, hypothesis testing is a structured approach to making inferences about populations based on sample data. It’s essential to understand the context, assumptions, and limitations of the chosen test for accurate conclusions, adhering to critical hypothesis testing rules.
Always double-check the requirements and assumptions of the selected test before proceeding with hypothesis testing.
Examples of Statistics Hypothesis Testing Cheat Sheet
Example 1: Mean Comparison (T-Test)
Scenario: A company claims that its new training program increases employee productivity. You want to test if there is a significant difference in the average productivity before and after implementing the program.
Example Hypotheses Testing:
- Null Hypothesis (H₀): The mean productivity before the training program equals the mean productivity after the training program.
- H₀: μ_before = μ_after
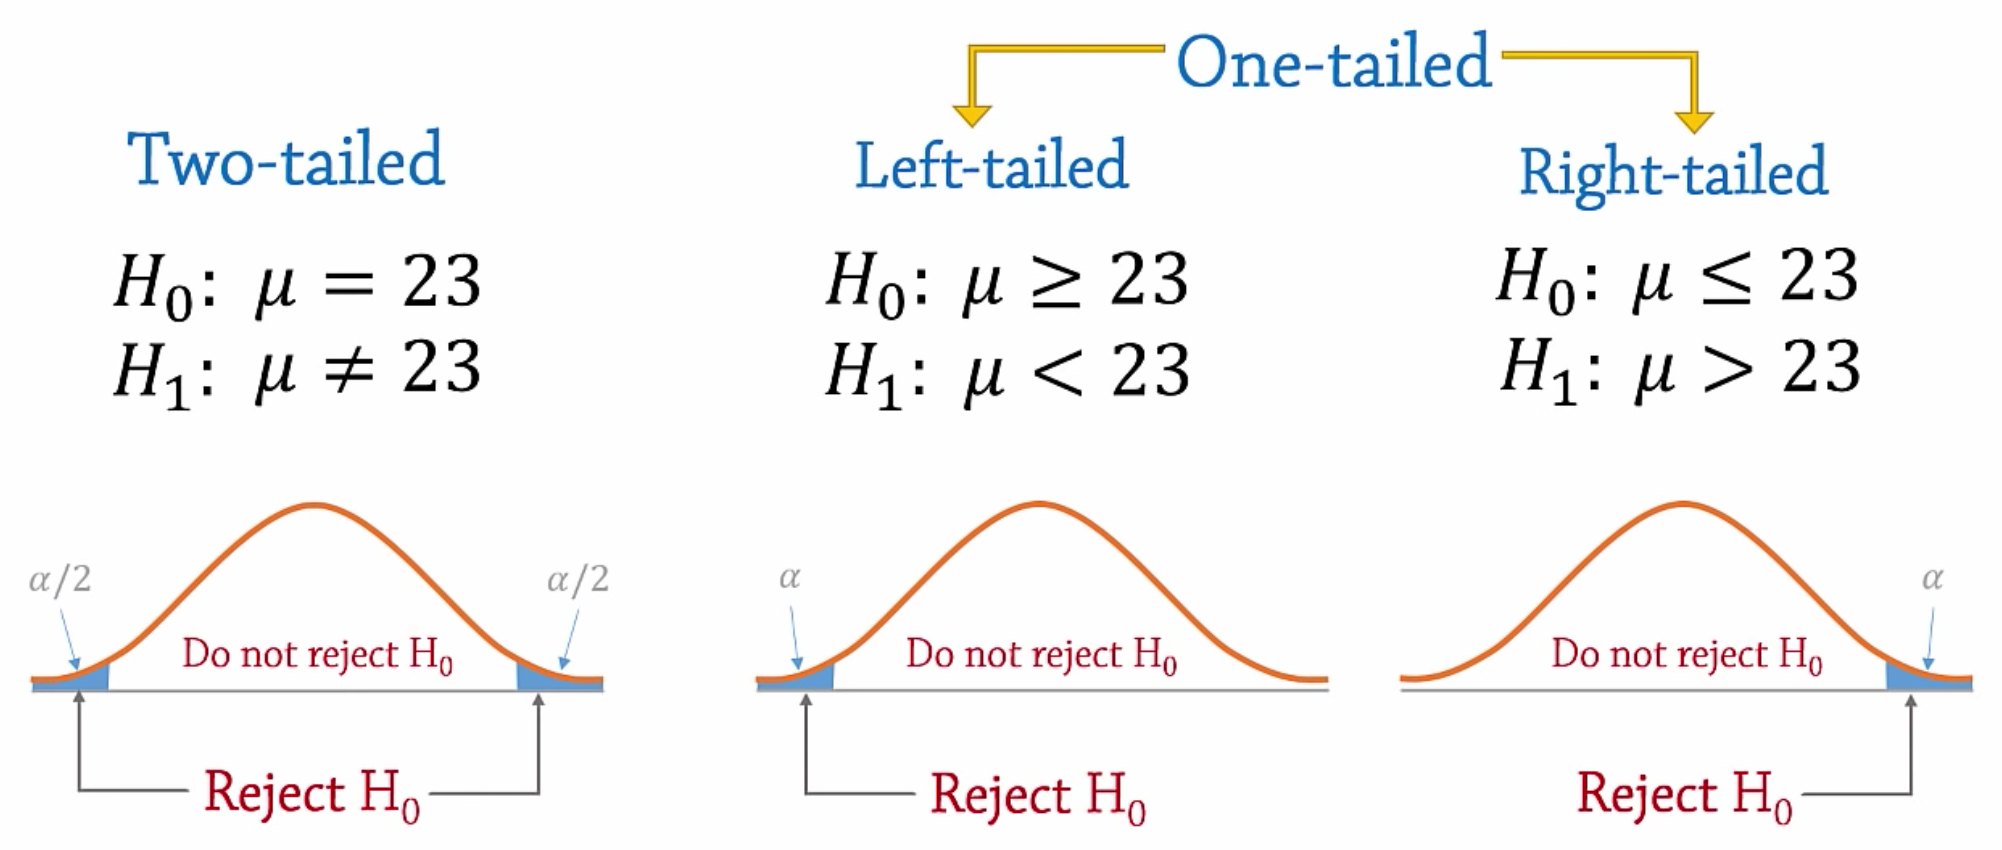
- Alternative Hypothesis (H₁): The mean productivity after the training program is greater than the mean productivity before.
- H₁: μ_after > μ_before
Statistical Test: Paired t-test (since data is collected from the same group before and after intervention).
Example 2: Proportion Comparison (Chi-Square Test)
Scenario: A researcher wants to determine if the proportion of people who prefer Brand A over Brand B is significantly different from an expected equal preference ratio.
Hypotheses:
- Null Hypothesis (H₀): The proportion of people preferring Brand A is equal to the expected proportion.
- H₀: p_A = p_expected
- Alternative Hypothesis (H₁): The proportion of people preferring Brand A is different from the expected proportion.
- H₁: p_A ≠ p_expected
Statistical Test: Chi-square test for independence (to compare observed and expected frequencies for categorical data).
Example 3: Comparison of Multiple Groups (ANOVA)
Scenario: An educator wants to determine if there is a difference in test scores among students who studied using three different methods.
Hypotheses:
- Null Hypothesis (H₀): The mean test scores for all three study methods are equal.
- H₀: μ_1 = μ_2 = μ_3
- Alternative Hypothesis (H₁): At least one mean test score is different from the others.
- H₁: At least one μ is different
Statistical Test: One-way ANOVA (to compare means of more than two independent groups).
Example 4: Correlation Testing (Pearson’s Correlation)
Scenario: A researcher wants to determine if there is a significant relationship between hours spent studying and exam scores.
Hypotheses:
- Null Hypothesis (H₀): There is no linear relationship between hours studied and exam scores.
- H₀: ρ = 0 (where ρ is the population correlation coefficient)
- Alternative Hypothesis (H₁): There is a linear relationship between hours studied and exam scores.
- H₁: ρ ≠ 0
Statistical Test: Pearson correlation coefficient (to measure the strength and direction of a linear relationship between two continuous variables).
These examples illustrate different scenarios, using the hypothesis testing rules each with its own null and alternative hypotheses, along with the relevant statistical tests based on the type of data and the research question.
Here’s a concise statistics hypothesis testing cheat sheet outlining the key concepts and steps involved:


