
A chi-square test is a statistical hypothesis test used to determine whether observed counts in categorical data differ significantly from what would be expected by chance. It comes in two forms that get confused constantly: a goodness of fit test, which checks whether one categorical variable matches an expected distribution, and a test of independence, which checks whether two categorical variables are related.
In Six Sigma, this is the tool of choice whenever your data is a count or category rather than a measurement, defect type by shift, pass/fail by supplier, complaint category by region. This guide breaks down both versions with worked formulas, a full DMAIC example, the sample size rule almost every online explanation gets wrong, and the mistakes that quietly invalidate a chi-square result.
| Aspect | Goodness of Fit Test | Test of Independence |
| Number of variables | One categorical variable | Two categorical variables |
| Question answered | Does this data match an expected distribution? | Are these two variables related? |
| Example use case | Does the current defect-type breakdown match last year’s? | Is defect type related to which shift produced it? |
| Data structure | A single row of category counts | A contingency table (rows x columns) |
| Degrees of freedom | Categories minus 1 | (Rows minus 1) x (Columns minus 1) |
| Formula | χ² = Σ (O − E)² / E | Same formula, different expected value calculation |
Table of contents
Key Takeaways
- The chi-square test only works on categorical (count) data, never continuous measurements. If your data is continuous, a t-test, ANOVA, or regression is the correct tool instead.
- There are two distinct types of chi-square test, and confusing them is the single most common mistake: goodness of fit compares one variable to an expected distribution, while a test of independence checks whether two variables are related.
- The standard expected-count rule requires every category or cell to have an expected frequency of at least 5, or the chi-square approximation becomes unreliable and a different test, such as Fisher’s Exact Test, is needed instead.
- Chi-square tests are most valuable in the Measure and Analyze phases of DMAIC, used to validate distributional assumptions or confirm whether a suspected input variable actually relates to a categorical outcome.
- A statistically significant chi-square result tells you variables are related, not why, which means chi-square screens candidates for root cause investigation; it does not confirm causation on its own.
What Is a Chi-Square Test?
A chi-square test (written χ² test) is a statistical hypothesis test used specifically for categorical data, information sorted into distinct groups or counts rather than measured on a continuous scale. It compares the frequencies you actually observed in your data against the frequencies you would expect if there were no real relationship or difference, and calculates how likely that gap is to have occurred by random chance alone.
The core formula is the same for every version of the test: χ² = Σ (O − E)² / E, where O is the observed frequency in a category and E is the expected frequency. Every category’s squared deviation, divided by its expected count, gets summed into a single chi-square statistic. A larger statistic means the observed data diverges further from what was expected, and that statistic gets compared against a critical value, or converted to a p-value, to decide whether the difference is statistically significant.
What separates chi-square from tools like the t-test or ANOVA is the data type it requires. According to statistical guidance from Pearson’s Chi-Square Calculator resource, chi-square requires categorical count data; continuous measurements need to be binned into categories first, which loses information, so t-tests or ANOVA remain the better choice for comparing means of continuous variables.

Public, Onsite, Virtual, and Online Six Sigma Certification Training!
- We are accredited by the IASSC.
- Live Public Training at 52 Sites.
- Live Virtual Training.
- Onsite Training (at your organization).
- Interactive Online (self-paced) training,
The Two Types of Chi-Square Test, and Why Confusing Them Matters
This is the detail most glossary explanations skip entirely, and it is the single most common source of error when practitioners apply chi-square incorrectly.
Chi-Square Goodness of Fit Test
This version tests a single categorical variable against a known or expected distribution. The question it answers: does my observed data match what I expected?
A classic example is testing whether a die is fair, rolling it 100 times and checking whether each face’s actual count is close to the expected 16.7 rolls per face. In a Six Sigma context, a goodness of fit test might check whether the current month’s defect-type breakdown still matches a historical baseline distribution, or whether defects-per-hour data actually follows a Poisson distribution before that assumption gets used in further analysis.
Chi-Square Test of Independence
This version tests whether two categorical variables are related to each other, using a contingency table (rows by columns) rather than a single row of counts.
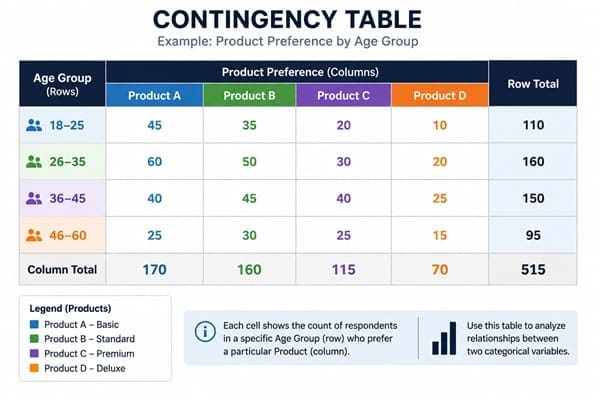
The question it answers: does knowing one variable tell you anything about the other? A Six Sigma example: testing whether defect type is independent of which production shift generated it. If defect type and shift turn out to be statistically related, that is a strong signal worth investigating further; if they are independent, shift is not a meaningful factor in defect type.
The two tests share the same underlying formula but calculate expected values differently. For a test of independence, the expected count for any cell in the table is calculated as (row total × column total) / grand total, a detail that trips up practitioners who try to apply the simpler goodness of fit expected-value logic to a two-variable problem.
Also Read: How to Conduct a Chi Squared Test for Proportions
A Worked Example: Applying Chi-Square in a Six Sigma Analyze Phase
A packaging plant Green Belt suspects that defect type is related to which of three production shifts produced the item. This is a textbook test of independence question, two categorical variables (defect type and shift), and a contingency table.
The team collects 300 inspected units and sorts them into a table by shift and defect category (torn label, incorrect seal, misaligned print). Using the expected-value formula for each cell, the team compares observed counts against what would be expected if shift and defect type were unrelated. The resulting chi-square statistic is compared against the critical value for the appropriate degrees of freedom, calculated as (rows − 1) × (columns − 1).
If the calculated chi-square statistic exceeds the critical value, the team rejects the null hypothesis of independence and concludes that defect type and shift are statistically related, a signal worth investigating further with root cause tools like 5 Whys or a Fishbone diagram, rather than a finished conclusion on its own.
If the statistic falls below the critical value, the team fails to reject the null hypothesis, meaning the data does not support a relationship between shift and defect type, and the team should look elsewhere for the driving variable.
The Sample Size Rule Most Explanations Get Wrong
Nearly every basic explanation of chi-square mentions running the test, but far fewer explain the rule that determines whether the result can be trusted at all.
According to statistical guidance widely used in Six Sigma training, the expected frequency in every cell or category should be at least 5. When this condition is not met, and especially when more than 20 percent of cells fall below that threshold, the chi-square approximation becomes unreliable, because the test relies on a continuous distribution approximating what fundamentally discrete count data is. When expected counts are too small, that approximation breaks down and the resulting p-value cannot be trusted.
The fix is not to run the test anyway and hope for the best. Practitioners facing small expected counts should either combine low-frequency categories into a broader group, collect additional data to raise the expected counts, or switch to Fisher’s Exact Test, which remains valid even with small samples.
Where Chi-Square Fits Inside DMAIC
Chi-square tests earn their place specifically in the Measure and Analyze phases, and understanding that placement helps avoid misapplying the tool later in a project.
- Measure phase: Chi-square goodness of fit tests validate distributional assumptions before those assumptions get used in further statistical work, confirming whether defect counts genuinely follow a Poisson distribution, for example, before that assumption drives a control chart selection.
- Analyze phase: Chi-square tests of independence screen suspected relationships between categorical input variables (X’s) and categorical outcomes (Y), narrowing a long list of suspected causes down to the ones worth investigating further with root cause tools.
- Not a Control phase tool: Chi-square confirms whether a relationship exists at a single point in time; it does not monitor an ongoing process the way a control chart does, and it should not be mistaken for an ongoing monitoring tool.
Also Read: Test Statistic
Real Examples of Chi-Square Applications
Manufacturing: Supplier and Defect Rate
A quality team tests whether defect rate is independent of which of four suppliers provided a raw material batch, using a test of independence to determine whether supplier choice is worth investigating as a root cause of quality variation.
Healthcare: Readmission and Discharge Day
A hospital tests whether patient readmission within 30 days is related to the day of the week a patient was discharged, screening for a scheduling or staffing pattern worth investigating further.
Retail: Return Reason and Store Region
A retailer tests whether the reason customers give for returning a product is independent of geographic region, checking whether a quality issue is isolated to a specific distribution center or supply route.
Software: Bug Category and Release Version
A development team tests whether bug category is related to which release version introduced it, using a goodness of fit comparison against the prior release’s known bug-category distribution to detect whether a new pattern has emerged.
Common Mistakes When Using Chi-Square
- Running chi-square on continuous data without binning it correctly, or worse, running it on continuous data directly. Chi-square requires categorical counts, not measurements.
- Confusing goodness of fit with test of independence, applying the wrong expected-value formula and drawing an invalid conclusion.
- Ignoring the expected-count-of-5 rule. A statistically significant result built on cells with expected counts below 5 cannot be trusted.
- Treating a significant chi-square result as proof of causation. Chi-square confirms a statistical relationship exists; it does not explain why, and root cause work still has to follow.
- Double-counting observations. Each unit inspected should appear in exactly one cell of the table; counting the same unit under multiple categories inflates the sample size artificially.
Frequently Asked Questions on Chi-Square Test
What is the difference between a chi-square goodness of fit test and a test of independence?
A goodness of fit test compares one categorical variable against an expected distribution. A test of independence checks whether two categorical variables are related to each other, using a contingency table rather than a single row of counts.
When should I use a chi-square test instead of a t-test?
Use chi-square when your data is categorical, counts or categories rather than continuous measurements. Use a t-test when comparing the means of continuous, measured data instead.
What sample size do I need for a valid chi-square test?
The expected frequency in each category or cell should be at least 5. If more than 20 percent of cells fall below that threshold, combine categories, collect more data, or use Fisher’s Exact Test instead.
Does a significant chi-square result prove causation?
No. A significant chi-square result confirms that a statistical relationship exists between the variables tested. It does not explain why that relationship exists, which requires further root cause investigation.
Where does chi-square fit inside a DMAIC project?
Chi-square tests are most commonly used in the Measure phase to validate distributional assumptions and in the Analyze phase to screen suspected relationships between categorical variables before deeper root cause analysis.
Final Words
Chi-square is the test Six Sigma practitioners reach for the moment their data stops being something they measure and becomes something they count. Getting it right means knowing which of the two versions applies, respecting the expected-count-of-5 rule, and treating a significant result as a lead worth investigating rather than a finished conclusion.
Six Sigma Development Solutions teaches chi-square testing, hypothesis testing, and the full Analyze phase statistical toolkit through onsite, live virtual, public, and online formats. Our Green Belt and Black Belt certification courses work through real categorical datasets, not just theory. View our upcoming Green Belt and Black Belt training schedule and get $500 off your next class.
About Six Sigma Development Solutions, Inc.
Six Sigma Development Solutions, Inc. offers onsite, public, and virtual Lean Six Sigma certification training. We are an Accredited Training Organization by the IASSC (International Association of Six Sigma Certification). We offer Lean Six Sigma Green Belt, Black Belt, and Yellow Belt, as well as LEAN certifications.
Book a Call and Let us know how we can help meet your training needs.


