

Table of contents
What Is Gage R&R: Gage Repeatability and Reproducibility
Manufacturers strive to reduce the variation of parts in their processes and improve the quality of products and processes. The fact is, there are variations in all manufacturing processes. To address variance, many designers assign a tolerance to their print dimensions. Statistical Process Control is then used to monitor the manufacturing process, including the collection of regular data. This helps keep the production in a “state of control”. Any SPC system will only work if the data is accurate and precise. All measurement data contain a certain amount of variation. The variation is the amount of difference between true values and observed values. The measurement error is represented by the variation. The actual variation in product or process is also included with the measurement error. The total variation is the result of combining measurement error and product or process variations. We must first determine whether the variation is acceptable to ensure that our measurements are accurate. Gage Reproducibility vs Repeatability (Gage R&R) is an effective tool to evaluate measurement variation.
What is Gage Repeatability and Reproducibility?
Gage Repeatability and Reproducibility is a method used to determine the amount of variance in measurement data caused by the measurement system. The system compares the measurement variation with the total observed variability, defining its capability. The two most important factors in measurement variation are repeatability and reproducibility. Repeatability is caused by equipment variation, and reproducibility by inspector or operator variations. Gage R & R is able to make the following known:
- The difference between the measurement system variance and the process variation
- Operator influence is responsible for a large amount of the variation in measurement systems.
- The ability of the measurement system to discriminate between parts
Why Perform Gage Reproducibility & Repeatability (Gage R&R)?
In any quality system, there are variations in the measurement data. Variation is inherent in all manufacturing processes. All measurements have some level of error or variance. To have the biggest impact on product quality, a robust SPC process needs accurate and precise data. We as quality professionals need to know what percentage of the variance is caused by the measurement system. Gage Repeatability and reproducibility have been proven to be a reliable method of evaluating the capabilities of a measuring system. Gage R & R studies examine the repeatability and reproducibility of equipment as well as the appraiser. Understanding Gage R & R enables us to predict the probability or percentage of measurement error and identify the source (equipment or the appraiser) of the variation. By determining where the variations in the measurement system exist, we can improve the quality and accuracy of our data. Better data will lead to better decisions and fewer mistakes.
How to Perform a Gage Reproducibility & Repeatability (Gage R&R)
There are several ways to complete a Gage R & R analysis. These are the two methods that are most commonly used to calculate Gage Repeatability and Reproducibility:
- The average and range method
- The ANOVA Method (Analysis of Variance).
This example uses a software program to perform the ANOVA. Both methods estimate three components of measurement error:
- Repeatability
- Reproducibility
- Part-to-part variation
ANOVA calculations can be more complex, but they also allow for a better distinction between appraisers and parts. Most software programs include ANOVA. This information can be used to identify the major contributors to variation in our MSA.

Data Collection
It is important that data collected for a Gage Repeatability vs Reproducibility analysis be random. Multiple appraisers measuring the same set in random order is standard. Two or three appraisers are usually used with five or ten parts. This study was designed as an example and not to analyze the process. Two appraisers/operators measured a group of ten parts twice in random order and recorded the results. The parts represented the full range of outputs. Digital calipers were used to take measurements. Decimal inches is the unit of measurement.
Calculations
In some cases, the calculations for the Average-and-Range method are done manually. The equations can be found in many sources. In this example, ANOVA is used. The variance can be divided into four categories using the ANOVA method:
- Part Variation
- Appraiser Variance
- Appraisers’ interaction with parts
- Replication error due to condition or characteristics of the Gage
Analysing the Gage R & R results
This study used statistical reports such as % Study Variance, % Contribution, and % Tolerance. These statistics provide valuable information. How you interpret them will depend on the purpose of your study.
- The % Contribution & % Study Reports identify the percentage variation in your process that is attributable to each source compared to the total variation. The data acknowledges that the measurement system is acceptable and determines if the variance is due primarily to operator, gage, or part variance. This information can be used to improve your system. Both reports use different parameters to judge the condition of the measurement system. The ranges of acceptance for the total Gage R & R percent are as follows.
- Study Variance in %
- 10% = Acceptable
- 10-30% = Acceptable depending on the method of measurement, application, etc.
- 30 % = unacceptable and needs improvement
- % Contribution:
- >1% = Acceptable
- 1-9% = Acceptable depending on the method of measurement and application
- >9% = Unacceptable – requires improvement
- Study Variance in %
Study Results
The results of the % Contribution indicate:
- The total contribution to R & R for Gage is 2.18%. This is well within acceptable limits because of the tool type and the application.
- There is no significant difference between the percentages of repeatability and reproducibility.
- If the repeatability is greater than the reproducibility, it could be a sign of a problem with the gage.
- If the repeatability is significantly greater than the reproducibility, it could be a sign of a problem with the appraisers’ accuracy or skills.
- The largest percentage of variance is due primarily to variation between parts
- Our measurement system is not adequate.
The results of the % Study Variance indicate:
- The total contribution to R & R for Gage is 14.75 %, which is within acceptable limits because of the tool type and its application.
- There is no significant difference between the percentages of repeatability and reproducibility.
- The largest percentage of variance is caused by part-to-part variations
The % Tolerance indicates that the measurement system can detect a nonconforming part. Our study’s data shows that our measurement system is not exhibiting any problems. The data can be further analyzed using graphical methods.
Visual Analysis Methods
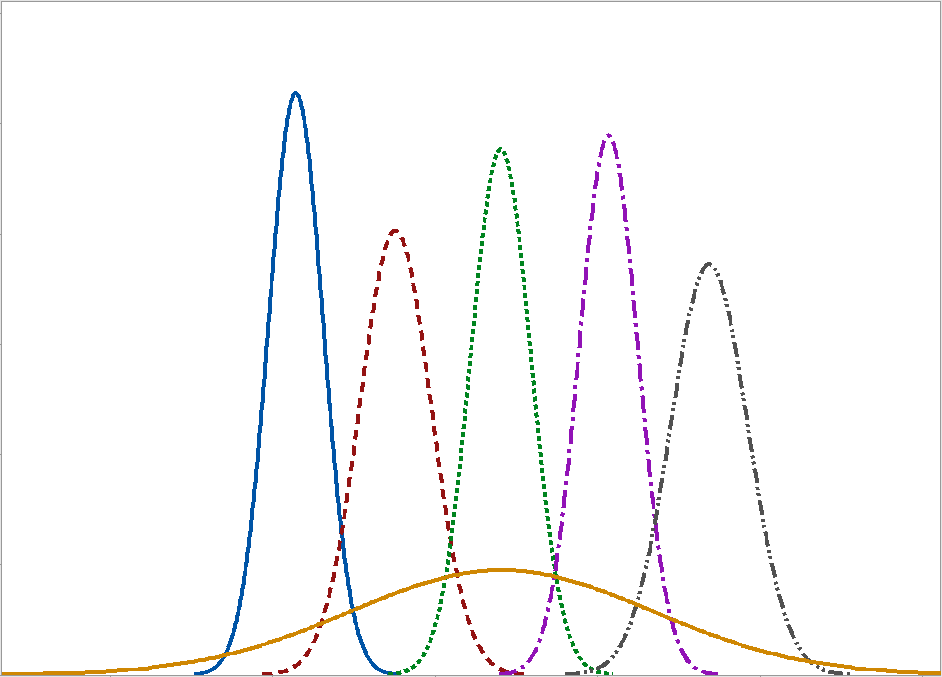
Gage R & R studies often include a graphic analysis. The methods of graphical analysis can be used to validate study findings and provide additional insights regarding data. Visualizing data using graphics is a powerful way to visualize it. The graphs show the accuracy of the measurement system and not the manufacturing process. The graphs included in this study are:
Scatter Plot by Operator
Pareto Analysis of Variation
R Chart by Operator
Xbar Chart by Operator
Response by Interaction
Response by Part
Box Plot – Response by Operator
Have you used this method in any of your projects?
Share your experience in the comments below!


