

Do you want to achieve near-perfect quality in your business processes? You might hear the term Six Sigma tools often, but you need to understand precisely how these instruments work together. Six Sigma is nothing but a powerful, data-driven methodology that focuses on removing the causes of defects and minimizing variation in manufacturing and business processes. Its ultimate aim is to ensure your process delivers only 3.4 defects per million opportunities (DPMO).
This approach helps your organization reduce waste, save costs, and significantly increase customer satisfaction. But, how do you actually implement this? The answer lies in a specific, powerful toolkit.
In this guide, you will learn about the six sigma tools that drive this process improvement, organized around the famous DMAIC framework. This framework acts as your roadmap for fixing existing problems.
Table of contents
- Comparison Chart: Key Six Sigma Tools
- Six Sigma Tools
- 1. Define Phase: Clearly Stating the Six Sigma Problem
- 2. Measure Phase: Quantifying the Six Sigma Process Performance
- 3. Analyze Phase: Identifying the Six Sigma Root Causes
- 4. Improve Phase: Implementing the Six Sigma Solutions
- 5. Control Phase: Sustaining the Six Sigma Gains
- Frequently Asked Questions (FAQs) about Six Sigma Tools
- Key Takeaways
- Final Words
- Related Articles
Comparison Chart: Key Six Sigma Tools
To understand this better, let us start with a clear comparison chart that highlights some of the most essential six sigma tools you will use for process improvement.
| Basis for Comparison | SIPOC Diagram (SIPOC) | Cause-and-Effect Diagram | Pareto Chart | Control Chart |
| Purpose | High-level process visualization and boundary definition. | Systematic identification of root causes for a specific problem. | Prioritizing the “vital few” causes that create most problems. | Monitoring process stability and variation over time. |
| DMAIC Phase | Define | Analyze | Analyze | Control |
| Output | A table defining Suppliers, Inputs, Process, Outputs, and Customers. | A diagram that categorizes potential causes (e.g., 6Ms). | A bar chart showing frequency in descending order, with a cumulative line. | A graph plotting data points over time against upper and lower limits. |
| Common Keyword | Process Mapping | Fishbone Diagram (Ishikawa) | 80/20 Rule | Statistical Process Control (SPC) |
Six Sigma Tools
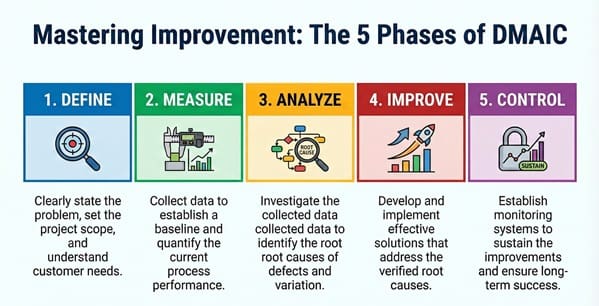
The DMAIC process is a structured, five-phase approach that guides every Six Sigma project. DMAIC stands for Define, Measure, Analyze, Improve, and Control. Each phase relies on specific six sigma tools to perform its function.
1. Define Phase: Clearly Stating the Six Sigma Problem
The first stage of the Six Sigma process involves clarifying the problem and setting the project scope. We must ensure the project aligns with the goals of organizational leadership.
SIPOC Diagram: Defining the Six Sigma Process Boundary
The SIPOC Diagram is a visual tool that defines the boundaries of a process and its key elements. SIPOC is an abbr. for Suppliers, Inputs, Process, Outputs, and Customers. This tool facilitates a shared understanding of the high-level process flow among all stakeholders.
The SIPOC Diagram helps a team clarify essential components.
- Suppliers are those who provide the inputs.
- Inputs are the resources the process needs.
- Process refers to the high-level steps.
- Outputs are the results generated.
- Customers receive the outputs.
A team uses the SIPOC Diagram with the aim of preventing scope creep and focusing the improvement effort.
Voice of the Customer (VOC): Understanding Customer Needs
Voice of the Customer (VOC) refers to the process of capturing a customer’s requirements and translating them into measurable process requirements. In simple words, this tool ensures that the improvement project focuses on what truly matters to the end-user.
- VOC provides critical data.
- VOC helps define what a defect actually means from the customer’s point of view.

Public, Onsite, Virtual, and Online Six Sigma Certification Training!
- We are accredited by the IASSC.
- Live Public Training at 52 Sites.
- Live Virtual Training.
- Onsite Training (at your organization).
- Interactive Online (self-paced) training,
2. Measure Phase: Quantifying the Six Sigma Process Performance
The Measure phase aims to establish a baseline metric for the current process performance. You need accurate data to understand the magnitude of the problem.
Data Collection Plan and Check Sheets
Before analysis can begin, a team requires a structured approach to gather information. A Data Collection Plan outlines the what, where, when, and how of data gathering.
- Check Sheets are simple forms used for systematic, convenient data collection.
- A well-defined plan ensures the collected data is accurate and reliable.
Histogram: Visualizing Data Distribution
A Histogram is nothing but a bar chart that displays the distribution of a process data set. This tool helps a team understand the shape of the data, the central tendency (mean), and the spread.
- Histograms indicate whether a process follows a normal distribution or contains outliers.
- The chart shows how frequently different values occur within a variable.
Also Read: Manual Testing Tools and the Software Testing Process
3. Analyze Phase: Identifying the Six Sigma Root Causes
The Analyze phase is critical. Teams analyze the collected data to investigate and verify cause-and-effect relationships. This is where you identify the root causes of variation and defects.
Cause-and-Effect Diagram: Mapping Potential Causes
The Cause-and-Effect Diagram, often called the Fishbone Diagram or Ishikawa Diagram, is a visual problem-solving tool. This tool explores the root cause of a particular issue.
The problem (the effect) is placed at the “head” of the fish, and potential causes branch out from the “backbone” into categories. These categories typically comprise 6Ms:
- Man (People)
- Machine (Equipment)
- Method (Procedures)
- Material (Components, raw data)
- Measurement (Process data)
- Mother Nature (Environment)
Cause-and-Effect Diagrams facilitate structured brainstorming so as to uncover multiple contributing factors.
Pareto Chart: Focusing on the Critical Few
The Pareto Chart is a statistical tool used for prioritizing factors based on their significance. This tool is based on the Pareto Principle, which asserts that roughly 80% of the problems result from 20% of the causes.
The chart displays data in descending order, showing which causes contribute most significantly to the overall problem. This allows the team to focus its efforts on the “vital few” factors.
The 5 Whys Technique: Deep-Dive Analysis
The 5 Whys technique involves repeatedly asking “Why?” to drill down to the root cause of a problem. This action leads to a result where a team can peel back layers of symptoms until the fundamental cause is revealed.
- Example: A machine stopped. Why? (The fuse blew.) Why? (The machine overloaded.) Why? (The lubricant was insufficient.) Why? (The operator forgot to check the oil.) Why? (The standard operating procedure does not require a pre-shift check.)
This technique prevents a team from addressing only the surface-level symptom.
Scatter Diagram: Checking Variable Relationships
A Scatter Diagram plots pairs of numerical data, allowing a team to examine the relationship between two variables.
- The visual pattern helps determine if a correlation exists.
- Scatter Diagrams confirm or disprove assumptions about cause-and-effect relationships.
For example, when you plot machine temperature versus defect rate, the resulting pattern indicates how one factor influences the other.
Regression Analysis and Hypothesis Testing
Regression Analysis quantifies the relationship between variables and facilitates predictions. Unlike the visual Scatter Diagram, this statistical tool provides measurable coefficients.
Hypothesis Testing comprises formal statistical methods that help a team determine if differences in data are statistically significant. This ensures that a team’s decisions are data-driven.
4. Improve Phase: Implementing the Six Sigma Solutions
The Improve phase focuses on developing and implementing solutions that address the verified root causes.
Brainstorming and Solution Implementation
Teams must generate a wide range of potential solutions. Brainstorming is often the first step, followed by structured selection tools like the PICK Chart. The PICK Chart is a 2×2 matrix that classifies ideas as Possible, Implement, Challenge, or Kill based on impact versus effort. This ensures effective, optimal utilization of resources.
Failure Modes and Effects Analysis (FMEA): Anticipating Risks
FMEA is a systematic process for identifying potential failures in a process or design before they happen. It assesses the risk of a failure mode by considering three elements:
- Severity (how serious is the effect of the failure?)
- Occurrence (how likely is the failure to happen?)
- Detection (how easily can you detect the failure?)
The FMEA helps prioritize action by calculating a Risk Priority Number (RPN), so as to prevent issues in design or process changes proactively.
Also Read: Data Quality Tools
5. Control Phase: Sustaining the Six Sigma Gains
The final phase ensures that the process improvements hold over time. The Six Sigma team establishes control mechanisms and monitoring systems to sustain the achieved results.
Control Charts: Monitoring Process Stability
The Control Chart is a specialized time-series graph that monitors process stability and variation. The chart plots data points over time, along with statistically determined upper control limits and lower control limits.
- If the process measurements stay within these limits, it indicates that the process is in control.
- A point falling outside the limits signals special cause variation, which means the team needs an immediate investigation.
Control Charts maintain quality and prevent the process from regressing to the old, less efficient state.
Control Plan and Standardized Work
A Control Plan acts as the written documentation that specifies how to maintain the improved process. It includes:
- Process monitoring methods.
- Measurement specifications.
- Response plans for out-of-control conditions.
Standardized Work means defining and documenting the current best practice for a process, ensuring that everyone performs the task in the same, most efficient manner. This consistency is vital for sustaining the low-variation state.
Frequently Asked Questions (FAQs) about Six Sigma Tools
What is the core Six Sigma methodology?
The core Six Sigma methodology is the DMAIC cycle—Define, Measure, Analyze, Improve, and Control. This systematic, five-phase process provides a roadmap for improving existing business processes by reducing defects and eliminating variation.
Why does Six Sigma focus on reducing variation?
Six Sigma focuses on reducing variation with the aim of ensuring predictable quality. When a process has high variation, the output is unstable, meaning that customers receive wildly different results. Reducing variation guarantees that the process output consistently meets the customer’s specified requirements.
How do I choose the right Six Sigma tool?
The choice of Six Sigma tool depends on the specific phase of the DMAIC project. For example, use SIPOC in the Define phase to map the process, and use a Pareto Chart in the Analyze phase to prioritize root causes. The DMAIC framework guides your selection, ensuring you use the right tool at the right time.
What is the purpose of Value Stream Mapping?
Value Stream Mapping (VSM) is a Lean Six Sigma tool that visually represents the entire flow of a product or service from the customer request to the delivery. The purpose of VSM is to identify all value-adding and non-value-adding steps so as to eliminate waste and optimize process flow.
Key Takeaways
- DMAIC is the core framework that guides the use of all Six Sigma tools.
- SIPOC and VOC define the project scope and customer focus.
- Graphical tools like the Histogram and Scatter Diagram help measure and analyze data distribution and relationships.
- Analytical tools like the Cause-and-Effect Diagram, 5 Whys, and FMEA identify and prevent root causes and potential failures.
- Control Charts and the Control Plan are essential for maintaining the improvements long-term.
Final Words
The array of Six Sigma tools provides a comprehensive and scientific approach to process improvement. These tools are more than just charts and diagrams; they represent a structured way of thinking that uses data to drive business decisions. They ensure your improvement efforts are not based on guesswork but on verifiable facts.
We know that a business must deliver consistently high-quality products or services. Six Sigma gives you the power to achieve this goal by providing the precise instruments for measurement, analysis, and control. It is our mission to ensure that your business realizes its maximum potential by leveraging these methods.
We stand ready to partner with you, focusing our expertise on reducing your operational risks and delivering the competitive advantage you need. We believe that a commitment to quality is a commitment to your success.
Contact us today to start defining your next process improvement project.

About Six Sigma Development Solutions, Inc.
Six Sigma Development Solutions, Inc. offers onsite, public, and virtual Lean Six Sigma certification training. We are an Accredited Training Organization by the IASSC (International Association of Six Sigma Certification). We offer Lean Six Sigma Green Belt, Black Belt, and Yellow Belt, as well as LEAN certifications.
Book a Call and Let us know how we can help meet your training needs.


