
DPMO (Defects Per Million Opportunities) is a standardized Six Sigma metric that measures how many defects a process would produce per one million opportunities for error. It matters because it lets teams compare defect rates fairly across processes of very different complexity, a 3-step process and a 50-step process can be benchmarked on equal footing once both are converted to DPMO.
The formula: divide total defects by total opportunities (units multiplied by defect opportunities per unit), then multiply by one million.
A true Six Sigma process performs at 3.4 DPMO, meaning it produces a usable result 99.99966 percent of the time. DPMO is also the metric used to calculate a process’s sigma level, which is what most Six Sigma benchmarking and reporting is actually built around.
Quick Reference Table
| Metric | Formula | What It Measures | Best Used For |
| DPU (Defects Per Unit) | Total Defects ÷ Total Units | Average defects per unit, regardless of complexity | Internal trending within one consistent process |
| DPO (Defects Per Opportunity) | Total Defects ÷ (Units × Opportunities per Unit) | Defect rate normalized for complexity | An intermediate step toward DPMO |
| DPMO | DPO × 1,000,000 | Defects per million opportunities | Comparing defect rates across processes of different complexity |
| PPM (Parts Per Million) | Defective Units ÷ Total Units × 1,000,000 | Defective units, not individual defects, per million | Simple pass/fail quality reporting |
| RTY (Rolled Throughput Yield) | Yield₁ × Yield₂ × … × Yieldₙ | The probability a unit passes every step in a multi-step process defect-free | Understanding true end-to-end process performance |
Table of contents
Key Takeaways
- DPMO normalizes for complexity. A process with many opportunities for error and a process with few can be compared fairly once both are converted to a per-million-opportunities basis.
- The formula has three inputs: defects, units, and opportunities per unit. Getting any one of these wrong, especially confusing “defect” with “defective,” produces a meaningless result.
- A “defect” and a “defective” unit are not the same thing. A defect is a single flaw; a defective unit has failed so badly it can’t be sold or used. One defective unit can contain multiple defects.
- 3.4 DPMO is the benchmark for a true Six Sigma process, corresponding to 99.99966% accuracy.
- DPMO converts directly to a sigma level, which is the standard way Six Sigma performance gets reported and compared, both internally and against industry benchmarks.
- DPMO, DPU, and DPO are related but distinct. DPU is the simplest and doesn’t account for complexity; DPO normalizes for complexity as a decimal; DPMO is DPO scaled to a per-million basis for readability.
- Rolled Throughput Yield (RTY) reveals the “hidden factory.” Multiplying yields across process steps almost always produces a lower number than any single step’s yield alone, exposing rework and scrap that a single-step yield figure hides.
What Is DPMO?
DPMO (Defects Per Million Opportunities) is a Six Sigma metric that expresses how many defects a process would generate per one million opportunities for a defect to occur. It is one of the foundational quality metrics in Six Sigma, and understanding it starts with two definitions that are easy to conflate but mean very different things.
Defect vs. Defective
A defective unit is one whose overall value or function has been compromised to the point that it can’t be used or sold; it’s “broken.” A defect is a single error, flaw, or imperfection that reduces a unit’s value but doesn’t necessarily make the whole unit unusable on its own. A defective unit will always contain at least one defect, but a single defect doesn’t automatically make a unit defective; that depends on the customer’s specifications and how many defects (or how severe a defect) it takes to cross that line.
Opportunities
An opportunity is any place in a unit or process step where a defect could occur. If a product has six distinct ways it could fail to meet specification, each unit produced represents six defect opportunities. Producing 100 of those units creates 600 total opportunities.

Public, Onsite, Virtual, and Online Six Sigma Certification Training!
- We are accredited by the IASSC.
- Live Public Training at 52 Sites.
- Live Virtual Training.
- Onsite Training (at your organization).
- Interactive Online (self-paced) training,
Why Does DPMO Matter?
Most organizations default to measuring the rate of defective units, since those are the ones that get rejected or returned. But that measurement alone limits an organization’s ability to actually improve its process, because it says nothing about the many smaller defects that didn’t quite cross the line into “defective” but are still reducing quality, increasing rework, or eroding customer satisfaction.
DPMO solves a second, equally important problem: fair comparison. A process with 50 opportunities for defects per unit will naturally accumulate more raw defects than one with 3 opportunities, even if the 3-opportunity process is actually performing worse on a percentage basis. Converting both to a per-million-opportunities basis puts them on the same scale, which is what makes DPMO useful for benchmarking across different products, departments, or process complexities.
The “per million” scale itself exists for a practical statistical reason: once a process approaches true Six Sigma performance, defects become so rare that a smaller denominator (per hundred, per thousand) wouldn’t have enough resolution to meaningfully measure them. At the Six Sigma benchmark of 3.4 defects, you need a denominator of one million to express that rate as a whole, countable number.
Also Read: Performance Baseline Measure: What It Is and How to Build One
How Do You Calculate DPMO?
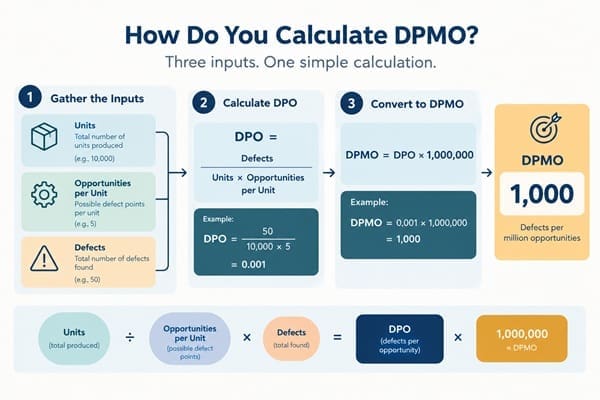
1. Determine Your Units and Defect Opportunities
Identify the total number of units produced and the number of distinct ways each unit could have a defect.
2. Calculate Total Opportunities
Multiply the number of units by the number of defect opportunities per unit.
Total Opportunities = Units × Opportunities per Unit
3. Calculate the Defect Rate (DPO)
Divide the total number of actual defects found by the total opportunities calculated in Step 2. This produces DPO (Defects Per Opportunity), expressed as a decimal.
DPO = Total Defects ÷ Total Opportunities
4. Convert to DPMO
Multiply DPO by one million.
DPMO = DPO × 1,000,000
Worked Example: Pencil Manufacturing
A pencil manufacturer identifies five defect opportunities per pencil: lead, wood, eraser, eraser clasp, and label. The organization produces 100 pencils and finds 4 defects.
- Total Opportunities = 100 units × 5 opportunities = 500
- DPO = 4 defects ÷ 500 opportunities = 0.008
- DPMO = 0.008 × 1,000,000 = 8,000 DPMO
This process is running at 8,000 defects per million opportunities, well above the 3.4 DPMO benchmark for true Six Sigma performance, but the number itself is only useful once it’s compared against a sigma level or an industry benchmark, which is the next step.
How Does DPMO Convert to a Sigma Level?
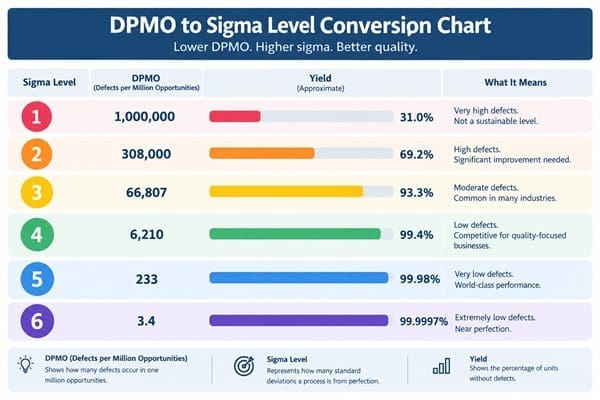
This is the piece of information most competing pages, including the previous version of this article, leave out entirely, and it’s the reason DPMO matters in Six Sigma reporting in the first place. DPMO converts to a sigma level, using a standard conversion table (assuming a common 1.5-sigma long-term process shift):
| Sigma Level | DPMO | Approximate Yield |
| 6σ | 3.4 | 99.99966% |
| 5σ | 233 | 99.977% |
| 4σ | 6,210 | 99.379% |
| 3σ | 66,807 | 93.32% |
| 2σ | 308,537 | 69.1% |
| 1σ | 691,462 | 30.9% |
How is this used in practice?
A process running at 8,000 DPMO, like the pencil example above, falls between the 4σ and 5σ benchmarks, meaning it performs well above baseline but still well short of true Six Sigma performance. Most quality software (Minitab, Excel with the NORMSINV function) can calculate an exact sigma level from a DPMO figure rather than relying on the nearest table value, but the table gives a fast, defensible reference point for reporting.
Also Read: Lean Six Sigma in Aviation: Applications, Tools, and Real Results
DPMO vs. DPU vs. DPO vs. PPM: How Do They Compare?
These four metrics are frequently confused, and knowing when to use which is genuinely useful, practical guidance the existing page doesn’t offer.
DPU (Defects Per Unit) is the simplest of the four: total defects divided by total units. It’s useful for tracking trends within a single, consistent process over time, but it doesn’t account for how many opportunities each unit actually has, which makes it unsuitable for comparing across processes of different complexity.
DPO (Defects Per Opportunity) normalizes DPU by dividing by the number of opportunities per unit, expressed as a decimal between 0 and 1. It’s mostly used as an intermediate calculation step toward DPMO rather than reported on its own.
DPMO scales DPO to a per-million basis, making it readable as a whole number and directly comparable across processes, departments, or organizations regardless of complexity.
PPM (Parts Per Million) is related but distinct: it measures defective units per million, not individual defects per million opportunities. PPM is simpler and common in supplier quality reporting, but it conflates the “defect vs. defective” distinction that DPMO deliberately preserves.
How Does DPMO Relate to Rolled Throughput Yield (RTY)?
DPMO and basic yield calculations describe individual process steps in isolation. Rolled Throughput Yield (RTY) measures what happens when those steps are chained together into a real, multi-step process, and the result is almost always worse than a quick glance at individual step yields would suggest.
RTY is calculated by multiplying the first-pass yield of every step in the sequence:
RTY = Yield₁ × Yield₂ × Yield₃ × … × Yieldₙ
For example, a three-step process with individual step yields of 95%, 97%, and 93% produces an RTY of 0.95 × 0.97 × 0.93 = 85.7%, meaning only about 86 out of every 100 units make it through the entire process without a single defect at any step, even though every individual step looks reasonably healthy on its own.
This is often referred to as exposing the “hidden factory,” the rework, scrap, and re-inspection that a single-step yield number conceals but that RTY reveals.
Common Mistakes When Calculating DPMO
- Confusing “defect” and “defective.” Counting defective units instead of individual defects understates the true opportunity for improvement and produces a different metric (closer to PPM) than DPMO is meant to measure.
- Miscounting opportunities per unit. Overstating or understating how many distinct ways a unit can fail directly skews the DPMO result; this figure needs to be defined consistently and defensibly before any calculation begins.
- Treating DPMO as directly comparable to PPM. The two metrics measure different things (defects vs. defective units) and shouldn’t be used interchangeably in reporting, even though they’re often confused.
- Reporting DPMO without the corresponding sigma level. A raw DPMO number means little to stakeholders without the context of where it falls on the sigma-level scale.
- Using single-step yield figures to describe an entire multi-step process. This overstates true process performance; RTY, not individual step yield, reflects what customers actually experience end-to-end.
When Should You Use DPMO?
Use DPMO when:
- You need to compare defect rates across processes, products, or departments with different levels of complexity.
- You’re calculating or reporting a process’s sigma level.
- Multiple distinct failure modes exist per unit, making a simple defective/non-defective count too coarse.
Use DPU or PPM instead when:
- You’re tracking trends within a single, unchanging process over time (DPU).
- You need a simple, supplier-facing pass/fail metric and complexity normalization isn’t the priority (PPM).
Frequently Asked Questions on DPMO
Q: What does DPMO stand for?
A: Defects Per Million Opportunities. It’s a Six Sigma metric measuring how many defects a process would produce per one million chances for a defect to occur.
Q: How do you calculate DPMO?
A: Multiply the number of units by the defect opportunities per unit to get total opportunities. Divide total defects by total opportunities to get DPO. Multiply DPO by 1,000,000 to get DPMO.
Q: What DPMO equals Six Sigma?
A: A true Six Sigma process performs at 3.4 DPMO, corresponding to a 99.99966% success rate, using the standard conversion table that assumes a 1.5-sigma long-term process shift.
Q: What is the difference between DPMO and DPU?
A: DPU (Defects Per Unit) simply divides total defects by total units and doesn’t account for how many opportunities each unit has. DPMO normalizes for that complexity, making it usable to compare processes with different numbers of defect opportunities per unit.
Q: What is the difference between DPMO and PPM?
A: DPMO measures individual defects per million opportunities. PPM (Parts Per Million) measures defective units per million total units. A defective unit can contain multiple individual defects, so the two metrics are related but not interchangeable.
Q: How is DPMO related to rolled throughput yield?
A: DPMO and standard yield describe a single process step. Rolled Throughput Yield (RTY) multiplies the yields of every step in a multi-step process together, revealing the true end-to-end probability that a unit passes through the whole process defect-free, which is typically lower than any single step’s yield would suggest.
Final Words
DPMO exists to answer a specific, practical question: how does this process actually perform once complexity is accounted for? Getting the defect-vs-defective distinction right, calculating the formula correctly, and translating the result into a sigma level are what turn a raw defect count into a metric that’s actually useful for benchmarking, reporting, and improvement decisions.
Understood alongside DPU, DPO, and RTY, DPMO becomes not just a number to report but a genuine diagnostic tool for where a process’s real performance gap sits.
Calculating DPMO correctly, and knowing how to translate it into a sigma level your leadership team can actually act on, is a foundational Measure-phase skill every Six Sigma practitioner needs.
Six Sigma Development Solutions, Inc. (SSDSI) is IASSC-accredited and 5-star rated on Google Reviews, having certified 5,322+ professionals across 600+ organizations in 52 cities. Our onsite, live virtual, public, and online Green Belt and Black Belt training covers DPMO, sigma level conversion, and the full family of Six Sigma quality metrics in the depth needed to apply them with confidence. Explore SSDSI’s Green Belt certification to build that foundation.
About Six Sigma Development Solutions, Inc.
Six Sigma Development Solutions, Inc. offers onsite, public, and virtual Lean Six Sigma certification training. We are an Accredited Training Organization by the IASSC (International Association of Six Sigma Certification). We offer Lean Six Sigma Green Belt, Black Belt, and Yellow Belt, as well as LEAN certifications.
Book a Call and Let us know how we can help meet your training needs.


