Table of contents
Estimated reading time: 8 minutes
Mean, Median & Mode: Measures of Central Tendency
Embark on a statistical journey as we unravel the mysteries of central tendency in our blog, ‘Mean, Median & Mode: Measures of Central Tendency.’ In the realm of data analysis, understanding the nuances of mean, median, and mode is crucial. Join us as we explore the interplay of these statistical measures and delve into the question: Is central tendency synonymous with the median? Discover the pivotal role the median plays as a measure of central tendency and gain insights into the broader concept of central tendency encompassing mean, median, and mode. Whether you’re a seasoned statistician or a curious learner, this exploration promises to demystify the intricate relationships within the world of central tendency.
What is Central Tendency?

Central tendency is a statistical concept that describes the central or typical value around which a set of data points tends to cluster. It provides a single value that represents the center or average of a distribution. Central tendency helps to summarize and describe the main characteristics of a dataset, offering a single representative value. The choice of which measure to use depends on the nature of the data and the specific characteristics of the distribution.
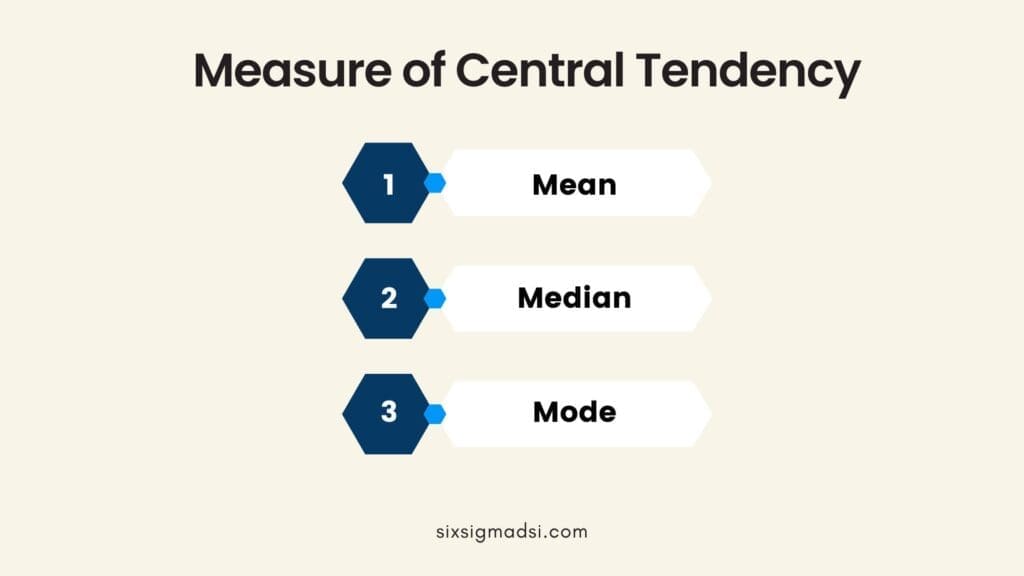
There are three main measures of central tendency:
- Mean
- Median
- Mode

Mean
In the realm of statistical analysis, the mean is a fundamental measure of central tendency that provides insight into the average value of a set of numerical data. Often referred to as the arithmetic mean, it is calculated by summing up all the values in a dataset and dividing the sum by the total number of observations. The mean serves as a representative value that reflects the center of the distribution.
As a key component of the trio of central tendency measures, alongside the median and mode, the mean offers a way to grasp the typical or central value of a dataset. While sensitive to extreme values, or outliers, the mean provides a valuable snapshot of the overall trend within the data. Understanding the concept of mean is essential for anyone venturing into statistics, offering a foundation for more advanced analyses and insights into the nature of numerical datasets. Stay tuned as we delve deeper into the intricacies of mean, alongside its counterparts, in our blog on “Mean, Median & Mode: Measures of Central Tendency.”
Median
The median is the middle value in a dataset when it is arranged in ascending or descending order. It is not influenced by extreme values and provides a more robust measure of central tendency, particularly in the presence of outliers.
The mean, often referred to as the average, offers a concise summary that goes beyond the mere arithmetic sum. Its application extends across diverse fields, from finance to science, where a singular figure can encapsulate the collective story told by the numbers. Join us as we delve into the significance of the mean, deciphering its strengths, nuances, and the insights it unveils about the central tendencies within datasets.
Mode
Mode stands as a critical measure of central tendency, representing the value that appears most frequently in a dataset. Unlike the mean, which focuses on the average, and the median, which identifies the middle point, the mode highlights the most common observation within a set of data.
Identifying the mode involves finding the value that occurs with the highest frequency, making it particularly useful for datasets with distinct peaks or clusters. In cases where a dataset exhibits multiple modes (bimodal or multimodal), or none at all (no mode), the concept of mode provides valuable insights into the distribution’s shape and characteristics.
As we navigate through the intricacies of central tendency in our blog, “Mean, Median & Mode: Measures of Central Tendency,” the role of mode becomes clearer, showcasing its significance in capturing the most prevalent values and contributing to a comprehensive understanding of the data’s central tendencies. Stay tuned for a deeper exploration into the multifaceted world of statistical measures.

When and How to Decide Which One to Use?
Choosing the appropriate measure of central tendency—mean, median, or mode—depends on the characteristics of the data and the nature of the analysis. Here’s a guide to help you decide which one to use in different scenarios:
- Symmetry of the Distribution:
- Use the mean when dealing with symmetrically distributed data. The mean is sensitive to extreme values, making it suitable for bell-shaped distributions.
- Skewed Distributions:
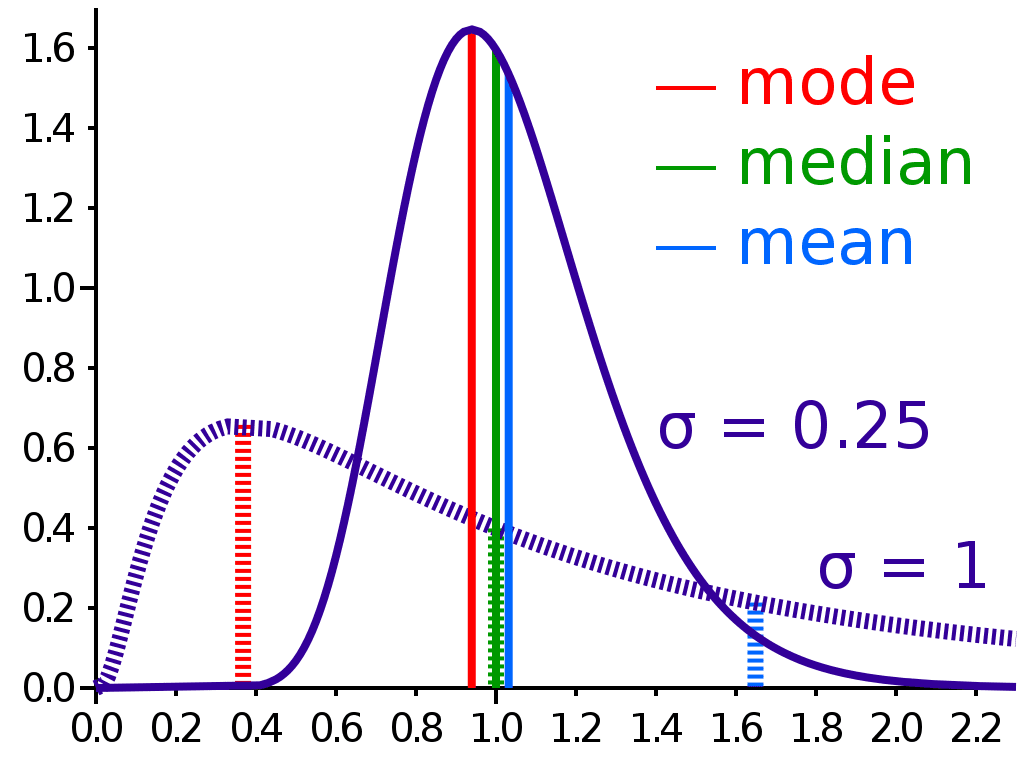
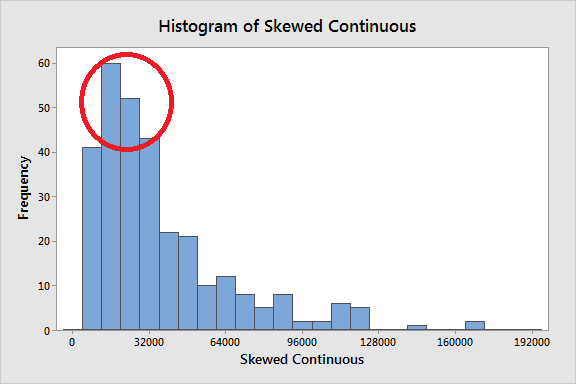
- Opt for the median when the data is skewed or contains outliers. The median is less influenced by extreme values and provides a robust central measure in such cases.
- Categorical Data:
- Employ the mode when working with categorical or nominal data. The mode identifies the most frequently occurring category, making it suitable for non-numeric datasets.
- Multimodal Distributions:
- Recognize the need for multiple measures in the presence of multiple modes. For bimodal or multimodal distributions, consider using a combination of mean, median, and mode to capture the complexity of the dataset.
- Data Characteristics:
- Reflect on the characteristics of your dataset. If the data is discrete and consists of distinct values, the mode may be more meaningful. For continuous data, the mean or median may be more appropriate.
- Data Insights:
- Consider the insights you aim to gain. The mean often provides an average or central value, the median offers robustness against extreme values, and the mode highlights the most common observation. Choose the measure that aligns with your analytical goals.
Real-Life Examples: Applying Mean, Median, and Mode
Understanding when to use mean, median, or mode is crucial in various real-life scenarios. Let’s explore practical examples illustrating the application of each measure:
Average Income in a Community:
- Mean: Calculate the mean income to determine the average earnings in a community. This provides an overall snapshot, but be cautious of extreme values, as a few high earners can significantly skew the mean.
- Median: Use the median income to find the middle point, which is less affected by outliers. This offers a more representative measure, especially in communities with income disparities.
Housing Prices in a Neighborhood:
- Mean: Compute the mean housing price to understand the average cost. However, be mindful of extremely high or low prices that may distort the mean, especially in neighborhoods with diverse housing options.
- Median: Opt for the median housing price when there’s a wide range of values. It provides a more robust central measure and is less influenced by outliers.
Exam Scores in a Classroom:
- Mean: Calculate the mean exam score to gauge the average performance of students. The mean is suitable when looking for an overall assessment, but be aware of the impact of a few exceptionally high or low scores.
- Median: Use the median score when there are outliers or a skewed distribution. It represents the middle point and is less sensitive to extreme values.
Popular Ice Cream Flavor in a Survey:
- Mode: Identify the mode when analyzing survey responses for the most popular ice cream flavor. The flavor with the highest frequency is the mode, providing insight into the preference of the majority.
- Mean/Median: While mean and median may not be as relevant for categorical data like ice cream flavors, they can still be calculated if, for example, you want to explore the average or middle-ranked preference.
Traffic Volume on a Road:
- Median: Determine the median traffic volume to understand the middle point of the distribution. This is useful in scenarios where a few instances of heavy traffic could distort the mean.
- Mean: Calculate the mean traffic volume for an overall average. However, be cautious of extreme congestion, as it can significantly impact the mean.

About Six Sigma Development Solutions, Inc.
Six Sigma Development Solutions, Inc. offers onsite, public, and virtual Lean Six Sigma certification training. We are an Accredited Training Organization by the IASSC (International Association of Six Sigma Certification). We offer Lean Six Sigma Green Belt, Black Belt, and Yellow Belt, as well as LEAN certifications.
Book a Call and Let us know how we can help meet your training needs.


