
A bimodal distribution is a probability distribution with two distinct peaks, separated by a valley. Each peak is called a mode — the value or range where data points concentrate most densely. When a histogram of process data shows two peaks, it is almost always telling a practitioner the same thing: two different sub-populations or process conditions are mixed together in one dataset, producing two separate centers of gravity instead of one.
In Six Sigma, a bimodal distribution is not just a statistical curiosity. It is a diagnostic signal that the Measure phase data collection has captured two processes at once — and that the Analyze phase must separate them before any meaningful root cause work can begin.
Table of contents
Meaning of Bimodal Distribution
A bimodal distribution is a frequency distribution that contains two distinct peaks (modes) separated by a lower-frequency valley. It typically occurs when data from two different sub-populations, processes, machines, shifts, or conditions are combined into a single dataset. Each sub-population produces its own peak.
In Six Sigma, a bimodal distribution appearing in a histogram is a warning sign that the data contains a hidden stratification variable. Calculating process capability (Cpk) on bimodal data produces a misleading result and must not be done until the two populations are separated and analyzed individually.
Key Takeaways
- A bimodal distribution contains exactly two modes — two distinct peaks in the frequency distribution — separated by a valley of lower frequency.
- The most common cause in a Six Sigma context is mixing data from two different sub-populations: two shifts, two machines, two operators, two suppliers, or two measurement methods in a single dataset.
- A bimodal distribution is a red flag during the Measure and Analyze phases of DMAIC. It signals that the data must be stratified before any root cause conclusions are drawn.
- Calculating Cpk or process capability on bimodal data produces an unreliable result. The standard capability formulas assume a unimodal, approximately normal distribution.
- The correct Six Sigma response to a bimodal distribution is to identify the stratification variable that separates the two peaks, split the data, and analyze each sub-population independently.
- A bimodal pattern can also arise from incorrect histogram bin width selection. A practitioner must rule out this artifact before concluding that a true bimodal pattern exists in the process.

Public, Onsite, Virtual, and Online Six Sigma Certification Training!
- We are accredited by the IASSC.
- Live Public Training at 52 Sites.
- Live Virtual Training.
- Onsite Training (at your organization).
- Interactive Online (self-paced) training,
What Is a Bimodal Distribution?
A bimodal distribution is any probability distribution with two distinct peaks — two modes — in its shape. The word “bimodal” breaks down simply: bi means two, and modal relates to the mode, the most frequently occurring value or range in a dataset.
In a normal (unimodal) distribution, data clusters symmetrically around a single central value, producing the familiar bell-curve shape. In a bimodal distribution, data clusters around two different values, producing a shape that looks like two hills side by side, with a valley between them.
Modes vs. Peaks: A Precise Distinction
The term “mode” in statistics refers to the most frequently occurring value in a dataset. In a continuous distribution, a mode corresponds to a local peak in the probability density curve — the point where the curve reaches a local maximum before descending again. A bimodal distribution has two such local maxima.
When the two peaks are equal in height, the distribution is symmetrically bimodal. When one peak is taller than the other, the taller is called the major mode and the shorter is called the minor mode. In either case, the distribution is still bimodal as long as two distinct, separated peaks exist.
What Causes a Bimodal Distribution?
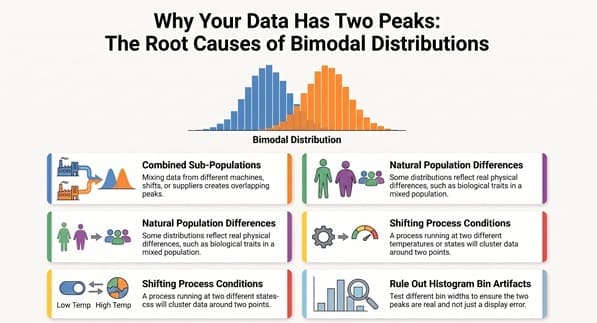
A bimodal distribution almost always has a specific, identifiable cause. It does not arise spontaneously from a single, stable process operating under consistent conditions. Understanding what generates two peaks is the first step to resolving them.
1. Two Sub-Populations Combined in One Dataset
This is the most common cause in process improvement work. When data from two distinct groups, each with its own natural center, is combined into a single histogram without stratification, the result is two overlapping distributions that together produce two peaks.
Classic examples in Six Sigma projects include:
- Data collected from two machines with different tooling wear rates. Machine A produces parts slightly under nominal; Machine B produces parts slightly over nominal. Combined, the histogram shows two peaks.
- Data collected across two shifts. The day shift operator sets up the process slightly differently from the night shift operator. Each produces a separate cluster of measurements.
- Data from two suppliers. Supplier A’s incoming material has a different dimensional center than Supplier B’s material. Mixed together, the data shows two peaks.
- Before-and-after data accidentally combined. If a process change occurred mid-collection, the data contains measurements from two different process states.
2. Natural Population Differences
Some bimodal distributions reflect genuine biological or physical differences in what is being measured, not a process problem at all. The adult black bear weight example is a well-known textbook illustration: female black bears average roughly 175 pounds while males average roughly 400 pounds.
Measuring weight across a mixed-sex population produces a bimodal distribution that reflects a real characteristic of the population, not a defect in the measurement process. In a Six Sigma project, this type of bimodal distribution means the stratification variable (in this case, sex) should be built into the analysis from the start.
3. Two Overlapping Process Conditions
A single process can generate bimodal data if it operates under two distinct conditions at different times. A batch chemical process that runs at two different temperatures (morning startup at 180°F, stabilized running at 220°F) will produce measurements that cluster around both temperatures if data is collected continuously across the temperature transition.
The fix is time-stratified data collection or separating warm-up data from steady-state data.
4. Artifact of Histogram Bin Width
A false bimodal pattern can appear when a practitioner chooses a bin width that is too narrow, creating jagged peaks between adjacent bins even in data that follows a smooth unimodal distribution. This is not a true bimodal distribution — it is a display artifact. Before concluding that a bimodal pattern is real, a practitioner should test several different bin widths.
A true bimodal distribution maintains two distinct, separated peaks across a range of reasonable bin widths. A false bimodal pattern caused by poor bin selection will disappear or shift when the bin width is adjusted.
Bimodal Distribution vs. Unimodal Distribution
Understanding the difference between a unimodal and bimodal distribution is a core competency for Six Sigma histogram interpretation.
| Feature | Unimodal Distribution | Bimodal Distribution |
| Number of peaks | One | Two |
| Shape | Single bell curve or skewed curve | Double-humped, with a valley between two peaks |
| Process interpretation | Single stable process condition operating consistently | Two different sub-populations or process conditions mixed in one dataset |
| Process capability (Cpk) | Can be calculated reliably with standard formulas | Must not be calculated until data is stratified and each peak is analyzed separately |
| Six Sigma response | Proceed with standard Analyze phase tools | Identify the stratification variable; split data; analyze each sub-population independently |
| Typical discovery phase in DMAIC | Measure phase histogram review | Measure phase histogram review |
A unimodal distribution indicates that the 6M inputs (Man, Machine, Method, Material, Measurement, Mother Nature) are working in a synchronized way to produce a consistent output. A bimodal distribution indicates that at least one of the 6M inputs is operating differently across the dataset, producing two distinct output centers. The Analyze phase must identify which input is responsible.
Also Read: Unimodal Distribution
Why a Bimodal Distribution Breaks Process Capability Calculations
Process capability indices — Cp and Cpk — are among the most widely used metrics in the Six Sigma Measure phase. They measure how well a process output fits within the customer’s specification limits. Their formulas assume that the data follows a single, approximately normal distribution with one mean and one standard deviation.
When a process produces bimodal data, those assumptions fail in a specific and important way. The calculated mean of a bimodal dataset falls in the valley between the two peaks — a value that may represent almost no actual measurements. The calculated standard deviation is artificially inflated because it spans the distance between both peaks.
The result is a Cpk value that does not accurately represent how either sub-population actually performs relative to the specification limits.
A practitioner who calculates Cpk on bimodal data and uses that number to make decisions is working from a misleading baseline. The correct approach is to:
- Identify and confirm that the bimodal distribution is real and not a bin-width artifact.
- Find the stratification variable that explains the two peaks.
- Split the data into two separate groups based on that variable.
- Calculate Cpk independently for each group.
- Use the resulting two capability values — one per sub-population — to make accurate decisions about each process condition.
How to Respond to a Bimodal Distribution in DMAIC
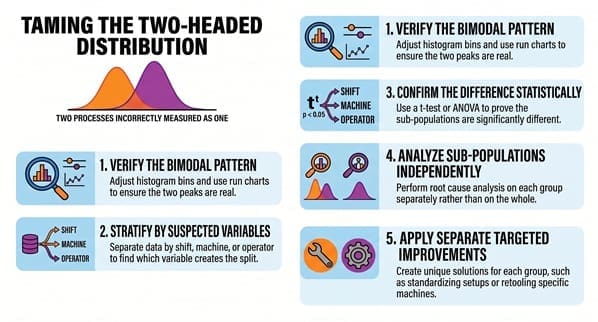
When a histogram reveals a bimodal distribution during the Measure phase of a DMAIC project, it changes the direction of the Analyze phase. A bimodal distribution is not a process to be improved in its current form. It is two processes that have been incorrectly measured as one. The job of the Analyze phase becomes identifying the hidden variable that explains the separation.
The following response sequence applies in most Six Sigma project contexts:
Step 1: Confirm the bimodal pattern is real. Adjust histogram bin widths to verify the two peaks persist across different display settings. Plot additional charts (run chart, box plots stratified by time) to see whether the peaks hold.
Step 2: Stratify by suspected variables. Common stratification candidates include shift, machine, operator, supplier, day of week, raw material lot, and measurement device. Create separate histograms for each candidate variable. If stratifying by Machine A and Machine B produces two unimodal histograms, the machine is the stratification variable.
Step 3: Confirm the stratification variable statistically. Use a two-sample t-test, Mann-Whitney test, or one-way ANOVA to confirm that the two sub-populations differ significantly, not just visually.
Step 4: Analyze each sub-population separately. Run root cause analysis on each group independently. The question is no longer “why is the overall process producing variation?” but rather “why does Machine A produce a different center than Machine B?” These are two different problems requiring two separate improvement paths.
Step 5: Improve each condition separately. Target improvements at the stratification variable. In a shift-based bimodal pattern, the improvement might standardize the setup procedure between shifts. In a machine-based pattern, it might calibrate or retool the lower-performing machine.
Also Read: Data Distributions
Bimodal Distribution and the Six Sigma IASSC Exam
Bimodal distribution is a testable concept on both the IASSC Green Belt and Black Belt certification exams. The IASSC Body of Knowledge includes histogram interpretation — specifically the ability to recognize non-normal distribution shapes, including bimodal — as part of the Measure phase curriculum.
A common exam question type is: “A histogram shows two peaks. What does this indicate?” The correct answer is that data from two different sub-populations or process conditions has been combined, and the data should be stratified before further analysis. A bimodal histogram does not indicate a process is in control, does not confirm data accuracy, and does not simply mean there are “two data points” — all of which are common wrong-answer options in practice exams.
At Six Sigma Development Solutions, our Green Belt and Black Belt training programs cover histogram interpretation in depth, including how to recognize and respond to bimodal, skewed, truncated, and other non-normal distribution shapes in the context of a real DMAIC project.
Frequently Asked Questions: Bimodal Distribution
Q: What is a bimodal distribution in simple terms?
A: A bimodal distribution is a dataset or probability distribution that has two distinct peaks, separated by a valley. Each peak represents a cluster of data points that concentrate around a different value. In most Six Sigma project contexts, a bimodal distribution means two different sub-populations — two shifts, two machines, two suppliers, or two process conditions — have been combined in a single dataset without stratification.
Q: What does a bimodal distribution tell you in Six Sigma?
A: A bimodal distribution tells a Six Sigma practitioner that the data being analyzed contains two distinct sub-populations or process conditions mixed together. It is a signal to stratify the data — to separate it by a suspected grouping variable such as shift, machine, operator, or supplier — before drawing any conclusions about the process or calculating process capability. Analyzing bimodal data as if it were a single unimodal population produces misleading results.
Q: What causes a bimodal distribution?
A: The most common cause in a Six Sigma context is combining data from two different process conditions in a single dataset without stratifying first. Common examples include data from two machines with different settings, two shifts using different procedures, two suppliers providing material with different dimensional centers, or before-and-after data collected across a process change without distinguishing the two states.
A false bimodal pattern can also arise from selecting a histogram bin width that is too narrow.
Q: Can you calculate process capability (Cpk) on bimodal data?
A: Standard Cpk calculations should not be applied to bimodal data without first stratifying and separating the two sub-populations. The standard Cpk formula assumes a single, approximately normal distribution with one mean and one standard deviation.
Applying it to bimodal data produces an inflated standard deviation estimate and a misleading mean that falls in the valley between the two peaks, neither of which accurately represents how either sub-population actually performs against the specification limits.
Q: How is a bimodal distribution different from a unimodal distribution?
A: A unimodal distribution has one peak, indicating data is clustering around a single central value from one stable process condition. A bimodal distribution has two peaks, indicating data is clustering around two different values from two different sub-populations or process conditions.
A unimodal distribution is the expected result from a single, stable, well-controlled process. A bimodal distribution is a warning sign that something is creating two distinct groups of outputs.
Q: What is the difference between a bimodal and multimodal distribution?
A: A bimodal distribution has exactly two peaks. A multimodal distribution has three or more peaks. The term “multimodal” is the general term for any distribution with more than one mode. In Six Sigma process analysis, both bimodal and multimodal distributions signal the presence of multiple sub-populations or process conditions in the dataset, requiring stratification before analysis can proceed.
Q: How do you fix a bimodal distribution in a process?
A: Fixing a bimodal distribution requires identifying and addressing what is causing two separate sub-populations in the data, not simply trying to force the process output to a single center.
The response sequence is: confirm the bimodal pattern is real (not a bin-width artifact), stratify by the suspected variable (shift, machine, operator, supplier), confirm the stratification statistically, analyze each sub-population separately, and implement improvements targeted at the source of the difference between the two groups.
Bimodal Distribution Training in Six Sigma
Recognizing a bimodal distribution and knowing how to respond to it correctly is one of the practical skills that separates a trained Six Sigma practitioner from someone who has only read a textbook. The interpretation of histogram shapes directly affects the quality of root cause analysis in the Analyze phase and the reliability of baseline data in the Measure phase.
At Six Sigma Development Solutions, histogram interpretation, stratification analysis, and the response to non-normal distributions are covered as applied skills in our Green Belt and Black Belt training programs — not as isolated statistical concepts.
We offer Six Sigma training in three formats:
- Onsite training — Delivered at your facility, using your real process data in histogram interpretation exercises during the Measure phase curriculum.
- Live virtual training — Instructor-led online sessions with guided Minitab practice, including histogram creation, bin width selection, and stratification analysis.
- Online training — Self-paced certification programs at Green Belt and Black Belt levels, covering all IASSC-testable distribution types.
Explore our Six Sigma training programs or contact our team to find the right program for your goals.
About Six Sigma Development Solutions, Inc.
Six Sigma Development Solutions, Inc. offers onsite, public, and virtual Lean Six Sigma certification training. We are an Accredited Training Organization by the IASSC (International Association of Six Sigma Certification). We offer Lean Six Sigma Green Belt, Black Belt, and Yellow Belt, as well as LEAN certifications.
Book a Call and Let us know how we can help meet your training needs.


