
In statistics, understanding the nature of data distributions is crucial for accurate analysis and interpretation. One fundamental type of distribution is the unimodal distribution. This guide delves into the concept of unimodal distributions, exploring their characteristics, types, applications, and significance in statistical analysis.
Table of contents
What is a Unimodal Distribution?
A unimodal distribution is a probability distribution that has a single peak or mode. This means that the data points cluster around one central value, forming a single prominent peak in the distribution curve. The term “unimodal” comes from the Latin “uni-” meaning one, and “modal” referring to mode, the value that appears most frequently in a dataset.
Unimodal distributions are contrasted with bimodal and multimodal distributions, which have two or more peaks, respectively. Understanding whether a distribution is unimodal helps in selecting appropriate statistical methods for analysis.

Public, Onsite, Virtual, and Online Six Sigma Certification Training!
- We are accredited by the IASSC.
- Live Public Training at 52 Sites.
- Live Virtual Training.
- Onsite Training (at your organization).
- Interactive Online (self-paced) training,
Characteristics of Unimodal Distributions

1. Single Peak: The defining feature of a unimodal distribution is its single peak. This peak represents the mode of the dataset, indicating the most frequent value. The distribution rises to this peak and then symmetrically or asymmetrically falls off on either side.
2. Gradual Decline: On both sides of the peak, the frequency or probability of values tends to decrease gradually, forming “tails” of the distribution.
3. Can be Continuous or Discrete: Unimodal distributions can describe both continuous data (like height or temperature) and discrete data (like the number of events in a fixed time).
4. Central Tendency Measures
In a unimodal distribution, the mean, median, and mode are typically close to each other. The symmetrical distribution of the data around a central value indicates this alignment, making interpretation and analysis easier.
5. Symmetry and Skewness
Unimodal distributions can be:
- Symmetric: Both sides of the peak are mirror images. The normal distribution is a classic example.
- Skewed Right (Positively Skewed): The right tail is longer. In this case, the mean is greater than the median.
- Skewed Left (Negatively Skewed): The left tail is longer. Here, the mode is greater than the median.
Understanding the skewness helps in determining the appropriate statistical methods and in interpreting the data accurately.
Types of Unimodal Distributions
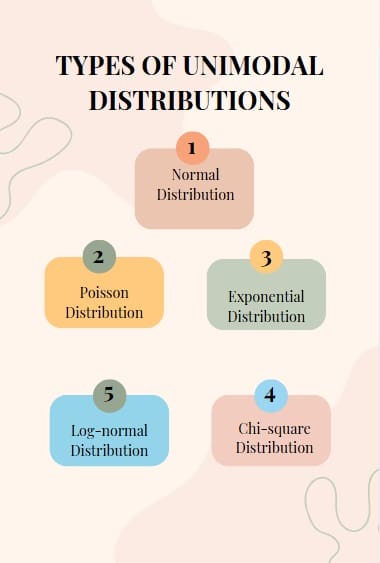
Several types of unimodal distributions are commonly encountered in statistics:
1. Normal Distribution
The normal distribution, also known as the Gaussian distribution, is the most well-known unimodal distribution. It is symmetric and bell-shaped, with the mean, median, and mode all coinciding at the center. Many natural phenomena, such as heights and IQ scores, follow a normal distribution.
The Poisson distribution models the number of events occurring within a fixed interval of time or space. It is commonly used in fields like telecommunications and traffic flow. The distribution is unimodal, with the peak representing the most likely number of events.
3. Exponential Distribution
The exponential distribution describes the time between events in a Poisson process. It is often used in reliability engineering and queuing theory. The distribution is unimodal, with the peak at zero, indicating the most likely time between events is very short.
4. Log-normal Distribution
A variable follows a log-normal distribution when its logarithm is normally distributed. This right-skewed distribution models phenomena such as income levels and stock prices.
5. Chi-square Distribution
The chi-square distribution arises in hypothesis testing, particularly in tests of independence and goodness-of-fit. It is a special case of the gamma distribution and is unimodal, with its peak shifting to the right as the degrees of freedom increase.
Also Read: What is Mode?
Mathematical Representation
Mathematically, a unimodal distribution can be represented by a probability density function (PDF). For example, the normal distribution’s PDF is:
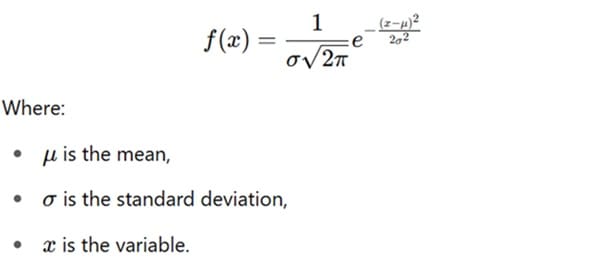
This equation illustrates how data points distribute around the mean by describing the bell-shaped curve of the normal distribution.
Examples of Unimodal Distributions
Many natural phenomena and statistical models exhibit unimodal distributions:
- Normal Distribution (Gaussian Distribution): This is the most famous example, characterized by its perfectly symmetrical, bell-shaped curve. Examples include heights of adult males, IQ scores, or measurement errors.
- Student’s t-distribution: Used for estimating population parameters when the sample size is small and the population standard deviation is unknown.
- Chi-squared distribution: Used in hypothesis testing.
- Exponential Distribution: Often used to model the time between events in a Poisson process (e.g., time between customer arrivals). It is right-skewed.
- Lognormal Distribution: The log-normal distribution describes data whose logarithmic values follow a normal distribution. It typically appears in phenomena like income distribution or particle sizes and is usually right-skewed.
- Poisson Distribution: Used for counting the number of events in a fixed interval of time or space (e.g., number of calls received by a call center per hour). While discrete, it often has a single peak.
- Heights of people in a specific age group: Most people will cluster around an average height, with fewer individuals being significantly taller or shorter.
- Exam scores in a single class: Most students will likely score around the average, with fewer scoring very high or very low.
Contrast with other modalities
- Bimodal Distribution: Has two distinct peaks, suggesting two different groups or processes within the data (e.g., heights of a group containing both adult men and women, or exam scores from two very different classes).
- Multimodal Distribution: Has more than two peaks.
- Uniform Distribution: Has no distinct peaks; all values within a certain range have approximately the same frequency, resulting in a flat-top shape.
Also Read: What is Bimodal Histogram?
Identifying Unimodal Distributions
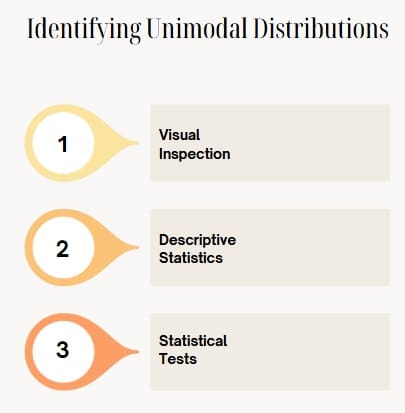
Identifying whether a dataset follows a unimodal distribution involves several steps:
1. Visual Inspection
Plotting the data using histograms or density plots can provide a visual indication of the distribution’s shape. A single peak suggests a unimodal distribution.
Calculating the mean, median, and mode can help determine the central tendency of the data. In a unimodal distribution, these measures are typically close to each other.
3. Statistical Tests
Tests like the Shapiro-Wilk test or Anderson-Darling test can assess the normality of the data, indicating whether it follows a unimodal distribution.
Also Read: Chi-Square Test
Applications of Unimodal Distributions
Unimodal distributions are prevalent in various fields:
- Natural Sciences: In biology, the distribution of species’ heights often follows a normal distribution.
- Social Sciences: IQ scores are typically normally distributed.
- Economics: Income distributions can be modeled using log-normal distributions.
- Engineering: The time between failures of components can be modeled using exponential distributions.
Advantages of Unimodal Distributions
- Simplified Analysis: With a single peak, analyzing the central tendency and variability becomes straightforward.
- Predictability: Models with a single peak are more predictable, aiding in forecasting and decision-making.
- Statistical Inference: Many statistical methods assume unimodal distributions, making them applicable in various analyses.
Limitations
- Assumption of Single Peak: Real-world data may not always be unimodal, requiring alternative models.
- Sensitivity to Outliers: Extreme values can skew results, affecting the distribution’s shape.
- Model Fit: Not all datasets fit unimodal distributions well, necessitating careful assessment before model application.
Final Words
Unimodal distributions are a cornerstone in statistics, providing a foundation for various analyses and interpretations. Understanding their characteristics, types, and applications aids in effective data analysis. While they offer simplicity and clarity, it’s crucial to assess whether a unimodal model fits your data appropriately. Always consider the context and nature of your data when choosing statistical models.


