Standard error vs standard deviation represents one of the most important distinctions in statistical analysis. Data analysts, researchers, and business professionals who master these concepts make better decisions, conduct more accurate analyses, and communicate findings more effectively. This comprehensive guide explores both measures, their differences, applications, and when to use each one.
Table of contents
- Understanding Standard Deviation
- Understanding Standard Error
- Standard Deviation vs Standard Error: Complete Comparison Table
- Key Differences Between Standard Error and Standard Deviation
- Practical Examples and Applications
- Common Mistakes and Misconceptions
- Advanced Applications and Techniques
- Best Practices for Implementation
- Final Words
- Frequently Asked Questions
- Related Articles
Understanding Standard Deviation
Standard deviation measures how spread out data points are from the mean (average) of a dataset. This fundamental statistical measure tells you whether your data points cluster tightly around the average or scatter widely across a range of values.
Statisticians calculate standard deviation by taking the square root of the variance, which represents the average of squared differences from the mean. This calculation gives you a measure in the same units as your original data, making it easy to interpret and communicate.
Data analysts use standard deviation to understand variability within a single dataset. High standard deviation indicates that data points spread far from the mean, while low standard deviation shows that most values cluster close to the average.
Understanding standard deviation helps you assess data quality, identify outliers, and make informed decisions about statistical analyses. Many statistical tests and business applications rely on standard deviation as a foundation for more complex calculations.
Standard Deviation Formulas:
- Population SD: σ = √[Σ(x – μ)²/N]
- Sample SD: s = √[Σ(x – x̄)²/(n-1)]

Public, Onsite, Virtual, and Online Six Sigma Certification Training!
- We are accredited by the IASSC.
- Live Public Training at 52 Sites.
- Live Virtual Training.
- Onsite Training (at your organization).
- Interactive Online (self-paced) training,
Understanding Standard Error
Standard error measures the precision of sample statistics, particularly the sample mean, in estimating population parameters. While standard deviation describes variability within your data, standard error describes uncertainty in your statistical estimates.
Researchers calculate standard error by dividing the standard deviation by the square root of the sample size. This calculation shows how much your sample mean would vary if you repeated the same study multiple times with different samples from the same population.
Standard error decreases as sample size increases, reflecting the statistical principle that larger samples provide more reliable estimates of population parameters. This relationship helps researchers determine appropriate sample sizes for their studies.
Understanding standard error enables you to construct confidence intervals, perform hypothesis tests, and evaluate the reliability of your statistical conclusions. It bridges the gap between sample data and population inferences.
Standard Error Formulas:
- Standard Error of Mean: SE = s/√n
- Standard Error of Proportion: SE = √[p(1-p)/n]
- Standard Error of Difference: SE = √(SE₁² + SE₂²)
Standard Deviation vs Standard Error: Complete Comparison Table
| Aspect | Standard Deviation (SD) | Standard Error (SE) |
| Definition | Measures the spread or dispersion of individual data points around the sample mean | Measures the precision of the sample mean as an estimate of the population mean |
| What it Measures | Variability within a single dataset | Uncertainty in the sample mean estimate |
| Formula | σ = √[Σ(x – μ)²/N] (population) s = √[Σ(x – x̄)²/(n-1)] (sample) | SE = SD/√n where n = sample size |
| Purpose | Describes how much individual observations deviate from the mean | Indicates how accurately the sample mean represents the population mean |
| Sample Size Effect | Remains relatively constant as sample size increases (describes the inherent variability) | Decreases as sample size increases (SE = SD/√n) |
| Units | Same units as the original data | Same units as the original data |
| Interpretation | Large SD = High variability in data Small SD = Low variability in data | Large SE = Less precise estimate Small SE = More precise estimate |
| Typical Range | Can be any positive value depending on data spread | Always smaller than SD (SE = SD/√n, where n ≥ 1) |
| Use in Research | Descriptive statistics to show data distribution | Inferential statistics for hypothesis testing and confidence intervals |
| Graphical Representation | Error bars show variability of individual data points | Error bars show uncertainty in the mean estimate |
| Confidence Intervals | Rarely used directly for confidence intervals | Commonly used: CI = mean ± (critical value × SE) |
| Hypothesis Testing | Not directly used in most statistical tests | Essential for t-tests, z-tests, and other inferential tests |
| Population vs Sample | Can be calculated for both population (σ) and sample (s) | Always relates to sample statistics and their precision |
| Stability | Stable – doesn’t change much with repeated sampling from same population | Variable – changes with different sample sizes from same population |
| Example Interpretation | “Individual scores vary by ±10 points from the mean” | “The sample mean is estimated with ±2 points precision” |
| Multiple Samples | Each sample has its own SD describing that sample’s variability | SE helps compare means across different samples |
| Relationship | SD = SE × √n | SE = SD/√n |
| Standard Normal Distribution | Used to standardize individual observations: z = (x – μ)/σ | Used to standardize sample means: z = (x̄ – μ)/SE |
| Common Mistakes | Using SD when you want to show precision of mean estimate | Using SE when you want to show data variability |
| Reporting in Papers | Report when describing sample characteristics: “Mean ± SD” | Report when making statistical inferences: “Mean ± SE” |
| ANOVA Context | Used to calculate within-group variability | Used in calculating test statistics (F-ratios) |
| Effect of Outliers | More sensitive to outliers (directly affects calculation) | Less sensitive to outliers (averaged effect across larger sample) |
| Quality Control | Primary measure for process variability and control limits | Secondary measure for monitoring sample mean stability |
| Meta-analysis | Used to describe heterogeneity between studies | Used to weight studies and calculate combined effect sizes |
Key Differences Between Standard Error and Standard Deviation
Purpose and Application
Standard deviation describes the variability or spread of individual data points within your dataset. Use standard deviation when you want to understand how much individual observations differ from the group average.
Standard error describes the precision of your sample statistics in estimating population parameters. Use standard error when you want to understand how reliable your sample-based estimates are for making inferences about the larger population.
These different purposes lead to different applications in research and business analytics. Standard deviation helps with descriptive statistics and data exploration, while standard error supports inferential statistics and hypothesis testing.
Understanding these distinct purposes prevents common mistakes in statistical analysis and ensures you choose the appropriate measure for your specific analytical goals.
Calculation Methods
Calculate standard deviation using the formula: σ = √[Σ(xi – μ)²/N], where σ represents standard deviation, xi represents individual data points, μ represents the mean, and N represents the total number of data points.
Calculate standard error using the formula: SE = σ/√n, where SE represents standard error, σ represents standard deviation, and n represents sample size. This simple relationship shows how standard error depends on both variability and sample size.
The calculations reveal why standard error always equals or is smaller than standard deviation. As sample size increases, standard error decreases, but standard deviation remains constant for the same population.
These mathematical relationships help you understand when each measure is appropriate and how changes in sample size affect your statistical estimates.
Interpretation Guidelines
Interpret standard deviation in the same units as your original data. If you measure heights in inches, standard deviation also appears in inches, making interpretation straightforward and intuitive.
Interpret standard error as the average amount your sample mean would vary across repeated samples. Smaller standard errors indicate more precise estimates, while larger standard errors suggest greater uncertainty.
Standard deviation tells you about the characteristics of your data, while standard error tells you about the reliability of your statistical estimates. This distinction guides proper interpretation and communication of results.
Both measures provide valuable information, but they answer different questions about your data and analysis. Clear interpretation ensures accurate conclusions and effective communication with stakeholders.
When to Use Standard Deviation
- Describing the spread of your data
- Showing variability within a group
- Creating control charts for quality management
- Comparing variability between different groups
- Reporting descriptive statistics
When to Use Standard Error
- Testing hypotheses about population parameters
- Creating confidence intervals for means
- Comparing means between groups statistically
- Reporting precision of estimates
- Conducting inferential statistical analysis
Practical Examples and Applications
Healthcare and Medical Research
Medical researchers use standard deviation to describe patient characteristics like age, blood pressure, or treatment response variability within study populations.
Clinical trials employ standard error to establish confidence intervals around treatment effects and determine whether new therapies show statistically significant improvements over existing treatments.
Public health surveillance systems use both measures: standard deviation to describe population health indicators and standard error to estimate disease prevalence with appropriate uncertainty ranges.
Quality improvement initiatives in healthcare settings often target reducing standard deviation in patient outcomes while using standard error to evaluate intervention effectiveness.
Manufacturing and Quality Control
Manufacturing processes use standard deviation to establish control charts and monitor product quality consistency. Lower standard deviation indicates better process control and more uniform products.
Quality assurance teams employ standard error when sampling products to estimate overall production quality and establish confidence intervals around defect rates.
Six Sigma methodologies focus on reducing process standard deviation to achieve higher quality levels while using standard error for sampling-based quality assessments.
Supplier evaluation often compares standard deviation in delivery times, quality metrics, and cost performance to identify the most reliable partners.
Financial Analysis and Investment
Portfolio managers use standard deviation to measure investment risk and volatility, helping clients understand the potential range of returns for different investment strategies.
Financial analysts employ standard error when estimating market parameters from sample data, such as average returns or correlation coefficients between different securities.
Risk management systems incorporate both measures: standard deviation for measuring historical volatility and standard error for quantifying uncertainty in risk model parameters.
Performance attribution analysis uses these measures to distinguish between skill-based investment returns and random market fluctuations.
Common Mistakes and Misconceptions
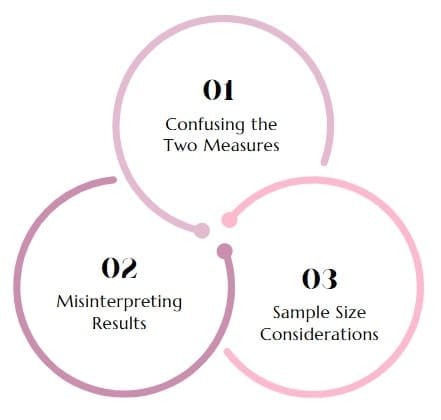
Confusing the Two Measures
Many analysts mistakenly use standard deviation when they should use standard error, particularly when making inferences about population parameters from sample data.
Researchers sometimes report standard deviation instead of standard error in scientific publications, making it difficult for readers to assess the precision of reported estimates.
Business presentations often confuse these measures when discussing survey results or market research findings, leading to misinterpretation of data reliability.
Statistical software packages sometimes default to one measure when users intend the other, requiring careful attention to output interpretation and proper measure selection.
Misinterpreting Results
Standard deviation misinterpretation often involves treating it as a measure of estimate precision rather than data variability, leading to incorrect conclusions about statistical significance.
Standard error misinterpretation frequently involves using it to describe data characteristics rather than estimate reliability, resulting in inappropriate data summaries.
Both measures suffer from unit confusion, where analysts fail to recognize that standard deviation shares units with the original data while standard error measures estimate precision.
Comparative analyses sometimes misuse these measures when evaluating differences between groups, leading to incorrect conclusions about statistical significance or practical importance.
Sample Size Considerations
Many analysts fail to recognize that standard error decreases with larger sample sizes while standard deviation remains relatively constant for the same population.
This relationship affects power analysis and sample size planning, where standard error considerations help determine adequate sample sizes for desired precision levels.
Studies with very large sample sizes may show statistically significant results due to small standard errors even when practical differences are minimal.
Conversely, studies with small sample sizes may fail to detect important differences due to large standard errors, leading to Type II errors in hypothesis testing.
Advanced Applications and Techniques

Meta-Analysis and Research Synthesis
Meta-analyses weight individual studies based on their standard errors, giving more influence to studies with larger sample sizes and more precise estimates.
Researchers combine effect sizes across studies using inverse-variance weighting, where studies with smaller standard errors receive greater weight in pooled estimates.
Heterogeneity assessment in meta-analyses examines whether standard errors alone explain variation between studies or whether additional sources of variation exist.
Publication bias detection often relies on funnel plots that display effect sizes against standard errors to identify potential missing studies.
Bayesian Statistics Integration
Bayesian analyses incorporate standard error information as precision parameters in likelihood functions, updating prior beliefs with sample-based evidence.
Credible interval construction in Bayesian frameworks uses concepts similar to standard error to quantify uncertainty in posterior distributions.
Model comparison techniques often evaluate how well different models account for both within-sample variation (related to standard deviation) and parameter uncertainty (related to standard error).
Hierarchical modeling approaches use standard error concepts to model uncertainty at multiple levels of analysis simultaneously.
Machine Learning Applications
Cross-validation procedures use standard error concepts to evaluate model performance variability across different training and testing dataset splits.
Bootstrap resampling techniques generate multiple sample-based estimates to calculate standard errors for complex statistics that lack analytical formulas.
Ensemble methods in machine learning often weight individual model predictions based on their estimated standard errors or prediction uncertainties.
Feature selection algorithms sometimes incorporate standard error considerations to identify variables that provide reliable predictive information across different samples.
Best Practices for Implementation
Choosing the Right Measure
Select standard deviation when your primary goal involves describing data characteristics, exploring dataset properties, or comparing variability between groups.
Choose standard error when making population inferences, constructing confidence intervals, performing hypothesis tests, or quantifying estimate precision.
Consider your audience when deciding which measure to report. Technical audiences may appreciate both measures, while general audiences often benefit from simpler presentations.
Document your choice clearly in reports and presentations to help readers understand what your statistical measures represent and how to interpret them.
Proper Reporting Standards
Report both measures when appropriate, using standard deviation to describe sample characteristics and standard error to quantify estimate precision.
Include sample sizes alongside standard error reports to help readers understand the basis for precision estimates and evaluate study adequacy.
Use consistent notation and terminology throughout your analyses to avoid confusion and ensure clear communication with stakeholders.
Provide context for your measures by comparing them to relevant benchmarks, industry standards, or previous studies when available.
Quality Assurance Measures
Verify calculations using multiple methods or software packages to ensure accuracy in both standard deviation and standard error computations.
Check that your measures make logical sense given your data characteristics and sample sizes, identifying potential calculation errors or data problems.
Validate interpretations by considering whether your conclusions align with the underlying statistical theory and the specific measures you’ve calculated.
Seek peer review or consultation when working with complex datasets or advanced applications to ensure appropriate measure selection and interpretation.
Final Words
While both standard deviation and standard error measure variability, they serve different purposes:
- Standard deviation quantifies the spread of data points in a single sample or population — it reflects how much individual values deviate from the mean.
- Standard error measures the precision of the sample mean as an estimate of the population mean — it reflects how much the sample mean is expected to vary if the sampling were repeated.
In essence, standard deviation is about variability within a dataset, while standard error is about the accuracy of the sample mean as a representation of the population. As sample size increases, standard error decreases, but standard deviation may remain the same.
Frequently Asked Questions
What is the main difference between standard error and standard deviation?
Standard deviation measures the spread of individual data points around the mean, while standard error measures the precision of sample statistics in estimating population parameters. Standard deviation describes data variability; standard error describes estimate reliability.
How do you calculate standard error from standard deviation?
Calculate standard error by dividing standard deviation by the square root of sample size: SE = σ/√n. This formula shows that standard error decreases as sample size increases, reflecting improved estimate precision with larger samples.
When should I use standard deviation vs standard error?
Use standard deviation for descriptive analysis, data exploration, and comparing variability between groups. Use standard error for inferential statistics, confidence intervals, hypothesis testing, and quantifying uncertainty in population estimates.
Why does standard error decrease with larger sample sizes?
Standard error decreases with larger sample sizes because bigger samples provide more reliable estimates of population parameters. The mathematical relationship SE = σ/√n shows this inverse relationship between sample size and estimate uncertainty.
Can standard error be larger than standard deviation?
No, standard error is always smaller than or equal to standard deviation. Since SE = σ/√n and sample size is always ≥ 1, standard error cannot exceed standard deviation. They’re equal only when sample size equals 1.
How do confidence intervals relate to standard error?
Confidence intervals use standard error to establish the range of plausible values for population parameters. Wider confidence intervals result from larger standard errors, indicating greater uncertainty in population estimates.
Should I report standard error or standard deviation in research papers?
Report standard deviation when describing sample characteristics and standard error when presenting inferential statistics. Many journals require both measures: standard deviation for descriptive statistics and standard error for means used in comparisons.
What happens to these measures with different sample sizes?
Standard deviation remains relatively constant for samples from the same population, while standard error decreases as sample size increases. This relationship explains why larger studies provide more precise population estimates.

About Six Sigma Development Solutions, Inc.
Six Sigma Development Solutions, Inc. offers onsite, public, and virtual Lean Six Sigma certification training. We are an Accredited Training Organization by the IASSC (International Association of Six Sigma Certification). We offer Lean Six Sigma Green Belt, Black Belt, and Yellow Belt, as well as LEAN certifications.
Book a Call and Let us know how we can help meet your training needs.