Value Stream Mapping (VSM) is a powerful tool in Lean methodology, designed to visualize, analyze, and optimize the flow of materials, information, and activities required to deliver a product or service to a customer.
By providing a holistic view of the production or operational process, VSM helps identify inefficiencies, waste, and opportunities for improvement, thus enhancing value delivery to the customer. This guide provides a comprehensive explanation of Value Stream Mapping, its purpose, benefits, and step-by-step implementation.
Table of contents
What is Value Stream Mapping?
Value Stream Mapping is a specialized flowcharting method that uses standardized symbols, often referred to as the “language of Lean,” to represent the steps in a process. Unlike conventional flowcharts, VSM goes beyond merely mapping the sequence of steps; it incorporates information about lead times, cycle times, inventory levels, and the flow of materials and information. It includes data such as:
- Processing times: Duration of individual tasks
- Wait times: Delays between steps
- Cycle times: Total time to complete a process
- Inventory levels: Stock at various stages
- Resources utilized: Labor, materials, and equipment
The mantra of VSM is to “strap yourself to the product (or service) and see where it goes,” allowing for an immersive understanding of the value creation process.
Video: Value Stream Map
Key Features
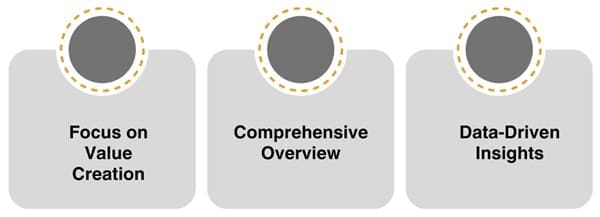
Focus on Value Creation: VSM emphasizes identifying steps that add value from the customer’s perspective and eliminating non-value-adding activities.
Comprehensive Overview: It provides a bird’s-eye view of the process, linking activities from the supplier to the customer.
Data-Driven Insights: It includes metrics like takt time, process time, and inventory levels to enable informed decision-making.
Core Principles of Value Stream Mapping
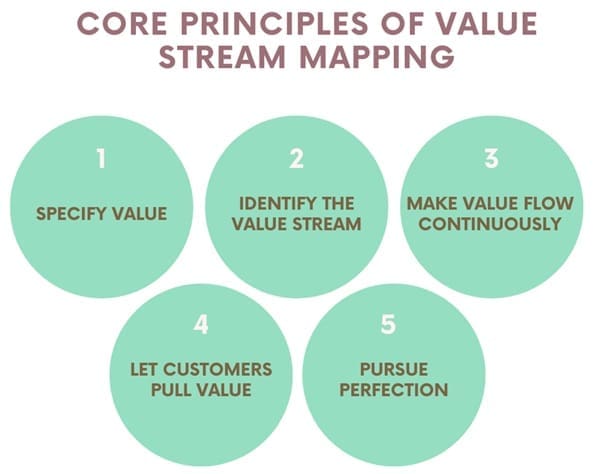
- Specify Value
Value is defined by the customer based on their needs and expectations. In the context of VSM, value encompasses the specific products and services customers seek, along with their quality and delivery requirements. By aligning processes with customer-defined value, organizations ensure that every step contributes meaningfully to the end product. - Identify the Value Stream
The value stream represents all the actions, both value-adding and non-value-adding, involved in transforming inputs into outputs. Mapping this stream provides visibility into inefficiencies and waste, enabling targeted improvements. Key components of a value stream include:
• Processes and sub-processes
• Materials flow
• Information flow - Make Value Flow Continuously
After identifying and eliminating waste, the remaining value-adding steps must flow seamlessly. This means reducing interruptions, delays, and bottlenecks, and ensuring that materials and information move efficiently across the process. - Let Customers Pull Value
A pull-based system ensures that production is driven by customer demand rather than forecasted predictions. This approach reduces overproduction and inventory waste, enabling just-in-time delivery. - Pursue Perfection
Continuous improvement is a cornerstone of VSM. Organizations must iterate on process improvements, striving for an ideal state where waste is entirely eliminated, and customer value is maximized.
Purpose of Value Stream Mapping
The primary goal of VSM is to create a value-creation process that minimizes waste while maximizing customer value. This applies to all stages of a product’s lifecycle:
- Design: From the concept stage to customer delivery.
- Build: From order receipt to final delivery.
- Sustain: From usage to lifecycle service and disposal.
Why Use Value Stream Mapping?
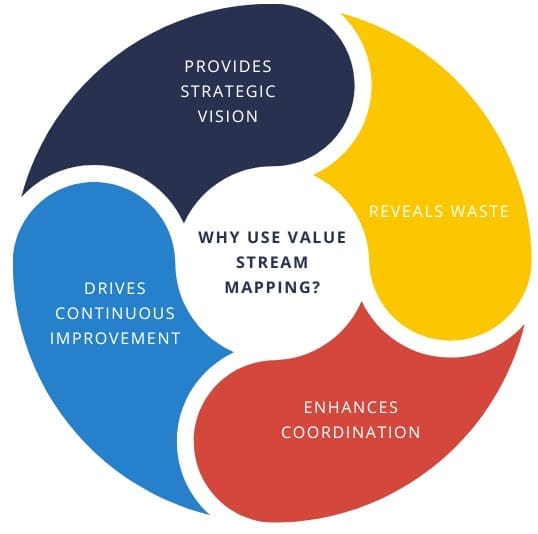
Organizations pursuing Lean transformations often realize that isolated improvement efforts are insufficient. Here’s why VSM is critical:
Provides Strategic Vision: By mapping the entire value stream, organizations can align individual improvement events with broader goals.
Reveals Waste: It makes inefficiencies like delays, redundancies, and bottlenecks visible.
Enhances Coordination: It serves as a communication tool, connecting teams and processes for collaborative improvements.
Drives Continuous Improvement: By comparing the current state with the desired future state, VSM creates a roadmap for systematic improvement.
Understanding “Value” in VSM
In Lean thinking, value is defined as a capability delivered to a customer that meets the following criteria:
- High Quality: Meets or exceeds customer expectations.
- Timely Delivery: Delivered when the customer needs it.
- Appropriate Cost: Priced competitively and fairly.
Value is determined entirely by the customer, making their expectations the central focus of all improvements.
Steps in Creating a Value Stream Map
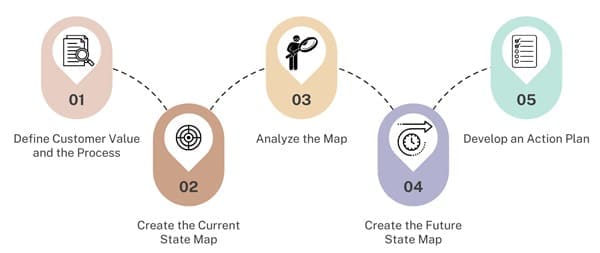
Step 1: Define Customer Value and the Process
Start by understanding what the customer values and how the current process delivers it. Walk through the process to document each step, identifying:
- Value-adding activities
- Non-value-adding activities (waste)
- Tasks and material flows
For instance, a hot dog stand may define value as “delivering fresh, tasty food quickly.” Mapping its process could reveal steps like order-taking, cooking, and packaging.
Step 2: Create the Current State Map
The current state map visualizes the existing process. Collect data on:
- Processing times: Time spent on tasks
- Quality: Rejection rates
- Wait times: Delays between steps
- Resource utilization: Labor, equipment, and materials used
By documenting these metrics, the organization can pinpoint inefficiencies.
Step 3: Analyze the Map
Analyze the current state map to identify improvement opportunities. Key questions to ask include:
- Which steps create value, and which do not?
- Where are the bottlenecks?
- What actions can reduce wait times or rework?
For example, if the cooking step takes significantly longer than other tasks, it may represent a bottleneck requiring attention.
Step 4: Create the Future State Map
The future state map envisions an optimized process. It outlines realistic improvements such as:
- Streamlined workflows
- Reduced inventory levels
- Improved synchronization between steps
For the hot dog stand, this might mean rearranging workstations to minimize movement or implementing parallel processes for order-taking and cooking.
Step 5: Develop an Action Plan
Translate the future state map into an actionable plan. Assign responsibilities, set timelines, and measure progress. Continuous feedback loops ensure that improvements are sustainable.
Also See: Lean Six Sigma Certification Programs, Reno, Nevada
Common Symbols in VSM
VSM uses standardized symbols to depict various elements of the process:
- Process Box: Represents an operation or activity.
- Inventory Triangle: Indicates stored materials.
- Arrows: Show the flow of materials and information.
- Kanban: Represents pull systems.
- Data Box: Contains key metrics for a process step.
These symbols help simplify complex processes and make them accessible to all stakeholders.
Benefits of Value Stream Mapping
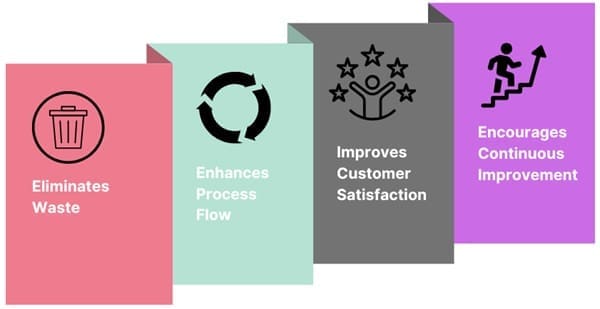
Eliminates Waste
By identifying non-value-adding steps, organizations can remove inefficiencies that waste time, resources, and money.
Enhances Process Flow
A continuous flow reduces delays and ensures smoother transitions between process steps.
Improves Customer Satisfaction
Aligning production with customer demand ensures timely delivery of high-quality products or services.
Encourages Continuous Improvement
The iterative nature of VSM fosters a culture of ongoing optimization and innovation.
Case Study
A hot dog stand serves as a simple yet effective example to illustrate VSM:
- Define Value: Customers value quick service and good food.
- Map Current State: The stand identifies steps such as order-taking, cooking, and delivery. Metrics reveal a cycle time of 7.4 minutes per customer, exceeding the takt time of 4.8 minutes.
- Analyze Map: Bottlenecks occur in cooking and packaging. Wait times between steps are significant.
- Create Future State: Improvements include reallocating tasks, streamlining workflows, and preparing ingredients in advance.
- Implement Changes: Action plans are executed, reducing cycle time to 5.8 minutes, closer to the takt time.
Challenges in Implementing VSM
- Resistance to Change
Employees may resist modifications to established workflows. - Complex Processes
Mapping intricate or poorly defined processes can be daunting. - Data Collection
Accurate and comprehensive data is essential but may be time-consuming to gather. - Sustaining Improvements
Ensuring long-term adherence to the future-state design requires ongoing monitoring and adjustments.
Best Practices
- Involve Cross-Functional Teams: Engage representatives from all relevant departments.
- Use Hand-Drawn Maps Initially: This encourages collaboration and allows for flexibility.
- Focus on the End Customer: Align every step of the process with customer expectations.
- Iterate and Update: Treat VSM as a dynamic tool that evolves with the process.
Real-World Application of VSM
A practical example of VSM is in manufacturing, where a company identifies inefficiencies in production:
- The current state map reveals excessive inventory between two processes.
- Analysis shows that batch production is causing delays.
- The future state map eliminates batch processing and introduces a pull system.
- The result is reduced lead time and improved on-time delivery.
Final Words
Value Stream Mapping is more than just a tool; it is a methodology that enables organizations to deliver value to their customers efficiently and effectively. By visualizing processes, identifying waste, and planning improvements, VSM helps organizations transition to Lean operations.
Whether applied in manufacturing, services, or product development, VSM empowers businesses to achieve their goals while keeping the customer at the forefront.

About Six Sigma Development Solutions, Inc.
Six Sigma Development Solutions, Inc. offers onsite, public, and virtual Lean Six Sigma certification training. We are an Accredited Training Organization by the IASSC (International Association of Six Sigma Certification). We offer Lean Six Sigma Green Belt, Black Belt, and Yellow Belt, as well as LEAN certifications.
Book a Call and Let us know how we can help meet your training needs.

