Table of contents
What is Standard Deviation in Lean Six Sigma?
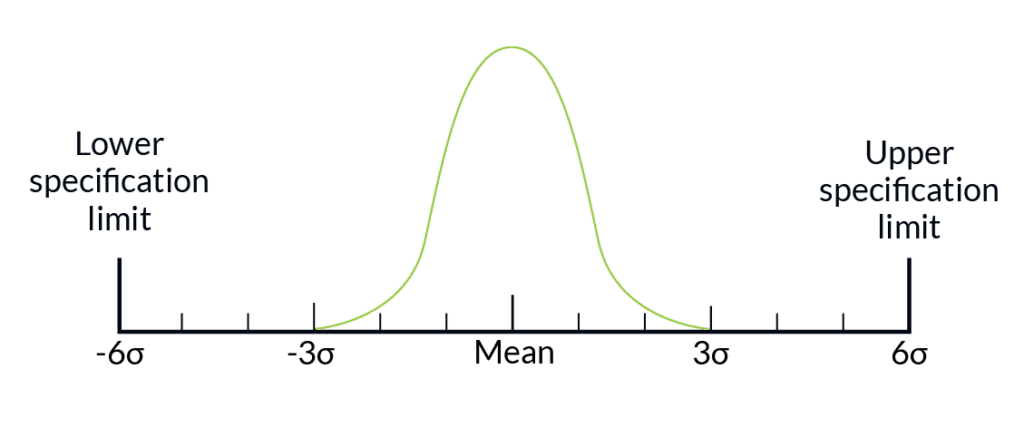
Standard deviation in six (6) sigma is a statistical measure teams use to analyze variation within a process. Six Sigma’s main goal is to reduce defects. Teams can reduce defects to increase productivity, lower costs, improve customer satisfaction, and maximize profit. Six Sigma is based on the idea that variance is at the heart of most defects.
If, for example, an oven heats up to 150 degrees within five minutes, and then stays at this temperature until the range is shut off, there is less chance of burning cookies. Cooks who measure each ingredient accurately are more likely than not to produce cookies with a consistent taste. Consistency is compromised when the recipe changes. Consistency is lost when there are defects. Cookies can burn if the oven does not maintain a constant temperature. The cookies may not be sweetened enough if the cook uses only a cup instead of a cup and a 1/2.
Variation makes for inconsistent quality. Note that eliminating variation does not improve quality. What if a cook always set the oven at 200 degrees and used only half a cup of sugar per batch? The results are the same as the process. The cookies will always taste bland and burned.
Six Sigma teams typically take a two-step approach to process improvements. They must first determine whether the process is functioning. Does the recipe for the cookie work? Does there even exist a recipe? Once the team has chosen a recipe that works, they will make changes to eliminate the variations that cause the outputs to differ from the intended result.
The standard deviation is the distance between the data points and the average of all the data. A significant standard error indicates an overall wide distribution of data points.
Why Calculate Standard Deviation?
The six-sigma standard deviation gives you a good idea of the amount of variation in a given process while taking into account outliers. The sample standard deviation, for example, indicates that the majority of grades will fall between 10.33 and 11.33 points on either side of the average. This tells the teacher that students’ test scores are fairly varied.
If the average score was 90, with a standard error of 3, then the teacher could assume that the students were learning the material and retaining it as expected.
If the standard deviation is 2, the teacher may assume that the students are not learning the material as they should or the test format was flawed.
These situations show a slight variation in how students perform, which indicates that the success or failure is tied to either the class, teaching, or test.
If the standard deviation was 30, then some students performed very well, while others did not. This situation could indicate to a teacher that certain students are lagging behind. Imagine that the teacher collected samples from different classes. The teacher may then investigate the results and find that most of the low scores came from one particular class. This could indicate that the teacher did not cover the concept adequately in that class.
The standard deviation can be used to identify where problems or possible solutions are located within a process. It is not the only way to determine whether a process is good or poor. It is also important to calculate because it is used in many other statistical methods that we cover in Six Sigma. Standard deviation is an important concept for statistical process control, analysis, and analysis of data. It can also be used as a starting point in Statistical Six Sigma.

How to Calculate Standard Deviation
Calculate the standard deviation using these two formulas. You can use the first formula to calculate population data, and then the second if you are calculating sample data.
Standard deviation formulas are different depending on whether or not you’re analyzing data from a population, which it would be called s, or estimating population standard deviations based on sample data. In this case, the formula is called s.
To calculate the standard deviation, you need to:
- Calculate the average of the data set. ( x bar or 1.m)
- Subtract each value from the data set by subtracting the mean.
- Step 2: Square the differences
- Step 3: Add the squared differences.
- Divide the total of step 4 by N (for sample data or population data), or (n-1) (Note: You now have the variance).
- To find the standard deviation, take the square root of your result in step 5.
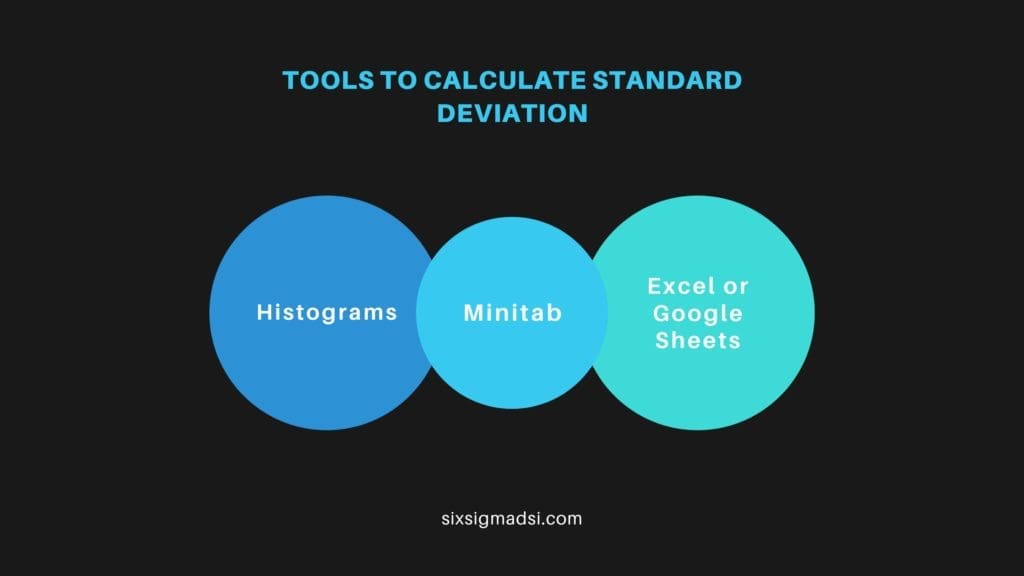
What are the Tools to Calculate Standard Deviation?
Control Charts Control charts are graphs that show how a variable in a process changes over time. These charts can be used to help identify patterns, trends, and shifts within a process and calculate the standard deviation using data collected over time.
- Histograms show the frequency distribution for a set of data. They can be used for identifying the shape of the distribution, outliers, and the spread of data. All of these are important inputs when calculating standard deviation.
- Software that performs statistical analysis is available in many forms, including programs for calculating the standard deviation. Minitab, SAS, and R are examples of statistical software.
- Excel is a popular tool for data analysis and statistics that has built-in functions to calculate the standard deviation. STDEV and STDEVP can be used to determine the standard deviation of a sample or population.

Why is Standard Deviation Important?
Standard deviation is important as it measures dispersion or volatility. The standard deviation tells you how far the data is from the average. It helps you to determine the risks and limitations of decisions made based on data.
Standard deviation can be used to assess risk when investing in stocks. It is safe to assume that a stock with an average of $50 and a standard deviation of 10 will close 95% of the time (two standard errors) between $30 ($50 – $10 – $10) and $70 ($50 +$10 +$10). You can assume that it will fall or rise outside this range 5% of the time. Comparing this stock to one that has a $50 average but a $1 standard deviation, you can assume with 95% confidence that it will end between $48 and $52. The second stock has a lower risk and is more stable. The risk is higher when the standard deviation is higher in comparison to the mean. For example, blue-chip stocks would have a low standard deviation relative to the mean.
Standard deviation is useful for many things, but first, you need to understand what it means. Standard deviation is also essential for understanding the Six (6) Sigma method.
Do you have any tips on how to successfully use standard deviation in Lean Six Sigma?
Leave them in the comments below!


