

Qualitative data tells you what customers experience and why they act as they do. It arrives as words, comments, and observations, not numbers.
Six Sigma teams usually start with Voice of the Customer data in the Define phase of DMAIC. They gather it, code it into themes, build a CTQ tree, and attach a measure to each need. The hard part is not collecting the words. The hard part is turning them into a target without losing what the customer meant. A good CTQ is specific, measurable, and comes from the customer, not from the company’s own opinion.
Quick-Reference Table: The Five Stages of Working With Qualitative Data
| Stage | Goal | Common Method | Output |
| 1. Collect | Hear the customer in their own words | Interviews, focus groups, gemba walks, complaints | Raw comments and notes |
| 2. Code | Label each idea | One code per idea | A codebook |
| 3. Group | Find patterns | Affinity diagram, themes | Named themes |
| 4. Translate | Make needs measurable | CTQ tree, operational definitions | CTQs with targets |
| 5. Verify | Check you heard it right | Review with the customer | Confirmed CTQs |
Table of contents
- Quick-Reference Table: The Five Stages of Working With Qualitative Data
- Key Takeaways
- What Qualitative Data Is (and Where This Guide Fits)
- Why Six Sigma Needs Words, Not Just Numbers
- Stage One: Collect From Reactive and Proactive Sources
- Stage Two: Code the Data
- Stage Three: Group Codes Into Themes
- Stage Four: Translate Themes Into a CTQ Tree
- Stage Five: Verify With the Customer
- Bias and Quality Checks
- Common Mistakes
- Frequently Asked Questions (FAQs) on Qualitative Data
- Final Words
- Turn Customer Words Into Measurable Goals With SSDSI
- Related Articles
Key Takeaways
- Qualitative data answers “why.” Numbers show how much. Words show the reason behind it.
- Start in the Define phase. Customer language shapes the problem statement and the goals.
- Code one idea per label. Mixed labels blur the patterns you want to see.
- Frequency is not importance. A code that appears often may not matter most to the customer.
- Stop interviewing when new interviews add little. Research on interviews often finds that saturation arrives within a dozen or so.
- Always attach a measure. A CTQ without a number cannot be tracked in Measure or Control.
What Qualitative Data Is (and Where This Guide Fits)
Qualitative data describes qualities, not amounts. Comments, interview notes, complaint text, and observations all count. For the full definition, including nominal versus ordinal types, see our glossary entry on qualitative data.
This guide covers the next question: what do you do with it? Many teams collect plenty of comments and then stall. They have a pile of words and no path to a measurable goal. The five stages above fix that.

Public, Onsite, Virtual, and Online Six Sigma Certification Training!
- We are accredited by the IASSC.
- Live Public Training at 52 Sites.
- Live Virtual Training.
- Onsite Training (at your organization).
- Interactive Online (self-paced) training,
Why Six Sigma Needs Words, Not Just Numbers
Numbers tell you where a process fails. Words tell you why the customer cares. A late delivery rate of 12% is a number. “I planned my day around that package” is the reason it matters.
Interviews give rich insight that surveys often miss, and the narrative helps a team understand what customers want and why. That “why” prevents a costly mistake. A team can polish a process that customers never complained about while ignoring the one thing that drives their anger.
Stage One: Collect From Reactive and Proactive Sources
Collect from two kinds of sources. Reactive data includes complaints, service calls, and warranty claims. Proactive data includes interviews, focus groups, and surveys. Gemba walks also help a team see the customer’s world firsthand.
| Source Type | Examples | Strength | Weakness |
| Reactive | Complaints, service calls, warranty claims | Arrives without effort and shows real pain | Hears only from people who complain |
| Proactive | Interviews, focus groups, surveys | You choose the questions and the people | Takes time and planning |
| Observation | Gemba walks | Shows what people do, not just what they say | Needs access and time |
Pick each method for a reason. Focus groups use group dynamics to surface ideas and help separate shared views from outlier opinions. One-on-one interviews work better when a topic is personal or complex.
Do not rely on one source. A team that reads only complaints hears the loudest customers. Blend sources to see the quiet ones too.
Also Read: Quantitative Data: Definition, Types, and Six Sigma Use
How Many Interviews Are Enough?
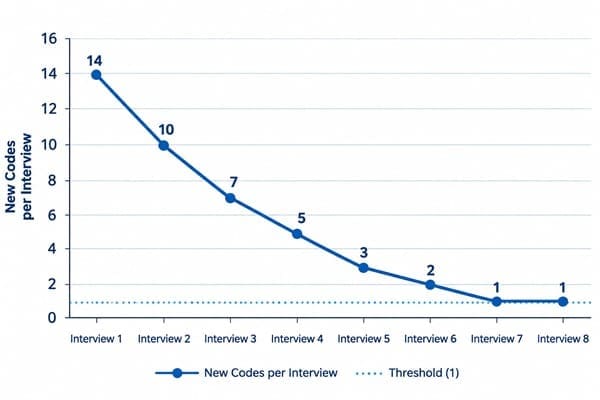
Use saturation as your stopping rule. Saturation means new interviews stop adding new ideas. One review notes that researchers found about 12 to 16 interviews adequate to reach thematic saturation. A widely cited experiment found that a fairly uniform sample largely reached saturation within twelve interviews, with the main themes visible after as few as six.
Treat these numbers as guidance, not law. Saturation relates to the size of the topic area. Some researchers also argue that a fixed quantity does not fit every analysis style. These findings come from qualitative research in general, not from a Six Sigma rule.
Track new codes after every interview. One study treated fewer than 5% new codes as a sensible threshold for saturation. Here is an illustration with made-up numbers.
| Interview | New Codes | Total Codes So Far | New Codes as % of Total |
| 1 | 14 | 14 | 100% |
| 2 | 9 | 23 | 39% |
| 3 | 6 | 29 | 21% |
| 4 | 4 | 33 | 12% |
| 5 | 3 | 36 | 8% |
| 6 | 2 | 38 | 5% |
| 7 | 1 | 39 | 3% |
| 8 | 1 | 40 | 3% |
Illustrative data. The curve flattens by interview seven, so this team could stop near eight.
Run each customer segment separately. A first-time buyer and a corporate buyer may raise different themes. Saturation in one group says nothing about the other.
Stage Two: Code the Data
Coding means labeling each idea in the text. A code is a label attached to a piece of data that captures a single idea. Follow these steps.
- Read everything once without coding. Get a feel for the whole set.
- Code one idea per label. Split a comment that holds two ideas into two codes.
- Use the customer’s words in code names. “Nobody told me” beats “communication issue.”
- Merge duplicates. Combine codes that mean the same thing.
- Keep a codebook. Write each code with a short definition and one example.
Check your own consistency. One research team had a second person independently code 10% of the responses, then tested agreement with Cohen’s kappa. A Six Sigma team can borrow the idea. Ask a colleague to code a sample, then compare and resolve differences. This step catches a single coder’s blind spots.
Stage Three: Group Codes Into Themes
Group related codes into themes. An affinity diagram is the classic Six Sigma tool for this. Write each code on a card. Move cards into clusters. Name each cluster in the customer’s language.
Do not decide the themes in advance. Let them emerge from the cards. Pre-set categories make you see only what you expected.
Frequency Is Not Importance
A common mistake is to rank themes by how often they appear. That sounds logical, but it can mislead. One study warns that the number of quotes citing a code does not necessarily show how relevant that code is. A topic may come up often only because it is easy to remember.
Use two tools to judge importance. The Kano model sorts needs into Basic, Performance, and Delighters. Pareto analysis can prioritize customer inputs.
| Kano Category | What It Means | What Happens If You Fail |
| Basic | Customers expect it without asking | Strong dissatisfaction |
| Performance | More is better | Satisfaction rises or falls with the level |
| Delighter | Customers do not expect it | Little loss if missing, strong delight if present |
The category meanings in the last two columns are standard Kano reasoning, summarized by the author.
Rank by impact, then by count. A rare Basic need that causes churn may outrank a frequent minor annoyance.
Stage Four: Translate Themes Into a CTQ Tree
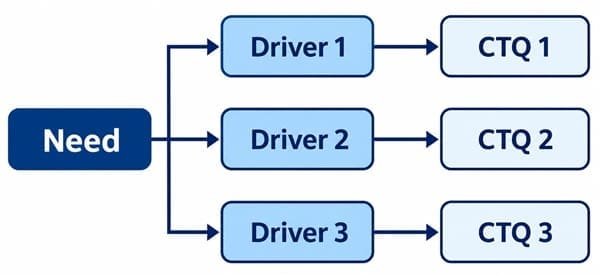
A CTQ tree turns a general wish into a measurable target. It starts with a Need, then breaks it into Drivers, which describe what the customer means by the need. Each driver then becomes a CTQ specification with a target.
Ask “why” until the meaning is clear. One guide suggests asking repeatedly, such as with the five whys, until you understand what the customer really means. “Fast” means different things to different people.
A Worked Example: Online Returns
This is an illustrative example, not a real company. An online retailer collects comments about its returns process.
| Raw Comment | Code | Theme |
| “I waited a week and nobody told me where my refund was.” | No refund status updates | Communication |
| “The return label never came.” | Label delay | Speed |
| “Chat and email gave different deadlines.” | Inconsistent information | Communication |
| “Refund was fast, I barely noticed.” | Fast refund (positive) | Speed |
| “I could not tell which items were returnable.” | Unclear eligibility | Clarity |
Now build the tree.
| Need | Driver | CTQ (measurable) | Illustrative Target |
| An easy return | I know where my refund stands | Status email sent after each step | Within 24 hours |
| An easy return | I get my label quickly | Time from return request to label email | Under 10 minutes |
| An easy return | I understand the rules | Return requests rejected for eligibility | Below 5% |
Notice the shift. The customer said “nobody told me.” The team now tracks “status email within 24 hours.” That is a number the Measure phase can baseline and the Control phase can monitor.
Also Read: SSDSI Helped the Nurses’ Health Studies Improve Operations and Research Data Quality
Operational Definitions: Make the Measure Unambiguous
Every CTQ needs a clear definition of how you measure it. “Quickly” is not a measure. “Minutes from the return request click to the label email timestamp” is.
Write each definition with four parts:
- Start point. What event begins the clock?
- End point. What event stops it?
- Data source. Which system holds the timestamps?
- Who measures. Who owns the report?
Skip this step and teams argue later. Two people will measure the same CTQ two different ways.
Stage Five: Verify With the Customer
Check your CTQs with real customers before you commit. One guide advises reviewing the CTQ tree with the customer to confirm the requirements will help them. A short follow-up call or survey is enough.
Ask two questions. Did we capture your need correctly? Would hitting this target solve your problem?
Use Qualitative First, Then Quantitative
The two data types work best in sequence. This design is common in practice and is the author’s recommended approach here.
- Explore with qualitative methods. Interviews and comments reveal themes.
- Size with quantitative methods. A survey with those themes shows how many customers feel each one.
- Measure the process. Baseline each CTQ with real data.
This order prevents a classic error. A survey built before interviews often asks about the wrong things.
Bias and Quality Checks
Qualitative work has its own traps. Use this checklist.
| Risk | What It Looks Like | Simple Guard |
| Leading questions | “Don’t you find the process slow?” | Ask open questions such as “Tell me about your last return” |
| Loud-voice bias | Only unhappy customers respond | Add proactive sources |
| Single coder | One person’s view shapes all codes | Have a second coder check a sample |
| Confirmation bias | You see what you expected | Let themes emerge before naming them |
| Tiny sample | Three interviews drive a big decision | Track saturation and cover each segment |
This table is the author’s synthesis of common qualitative research cautions.
Common Mistakes
Skipping the codebook. Without definitions, codes drift over time.
Ranking themes by count alone. Frequency can hide the needs that matter most.
Stopping at themes. A theme such as “communication” is not a CTQ. Keep going until you have a measure and a target.
Skipping verification. Teams can mishear customers, and a quick check costs little.
Treating Likert averages as exact. See our glossary entry for why ordinal data needs care.
Frequently Asked Questions (FAQs) on Qualitative Data
What is qualitative data in Six Sigma?
Qualitative data describes customer experience in words and observations, such as interview notes and complaint text. Teams use it, mostly in the Define phase, to understand needs before they set measurable goals.
How do you collect qualitative data for a Six Sigma project?
Common sources include interviews, focus groups, surveys, gemba walks, and complaint or service records. Reactive sources such as complaints show real pain, and proactive sources let you choose the questions.
How many interviews do I need?
Research often finds that thematic saturation arrives within about 12 to 16 interviews, and sometimes sooner for a uniform group. Track new codes after each interview and stop when new interviews add very little.
How do you analyze qualitative data?
Read the data, assign one code per idea, merge duplicates, group codes into themes, and name each theme. Have a second person code a sample to check consistency.
What is a CTQ tree?
A CTQ tree breaks a general customer need into drivers and then into specific, measurable requirements with targets. It links the customer’s words to numbers a team can track.
How do you turn qualitative data into measurable data?
Group comments into themes, build a CTQ tree, and write an operational definition for each CTQ. The definition states the start point, end point, data source, and owner of the measure.
Is a high count of comments the same as high importance?
No. A code can appear often for reasons that have nothing to do with importance. Use the Kano model and Pareto analysis to judge impact.
What is the Kano model?
The Kano model sorts customer needs into Basic, Performance, and Delighter categories. It helps teams decide which needs must be met and which create extra delight.
Should I use qualitative or quantitative data first?
Start with qualitative data to find themes and the reasons behind them. Then use quantitative methods to size those themes and baseline the process.
Final Words
Qualitative data earns its place in Six Sigma by explaining why customers care. The method has five stages: collect, code, group, translate, and verify.
Stop interviews when new ones add little, and judge themes by impact, not only by count. Turn each theme into a CTQ with an operational definition so the Measure phase has something concrete to baseline. Then check the result with the customer. That path carries a team from a pile of comments to a target it can actually hit.
Turn Customer Words Into Measurable Goals With SSDSI
Great projects start with a clear picture of what the customer needs.
SSDSI delivers IASSC-accredited Green Belt and Black Belt training through onsite, live virtual, public, and self-paced formats, covering the DMAIC framework, including the Define phase tools that turn customer input into CTQs. Every Green Belt and Black Belt student also gets a Master Black Belt mentor until the certification project is complete.
SSDSI has certified 5,322+ professionals across 600+ organizations in 52 cities, backed by a 5-star Google review rating. If you want to turn customer feedback into a project that delivers, a conversation about the right format is a solid next step.
About Six Sigma Development Solutions, Inc.
Six Sigma Development Solutions, Inc. offers onsite, public, and virtual Lean Six Sigma certification training. We are an Accredited Training Organization by the IASSC (International Association of Six Sigma Certification). We offer Lean Six Sigma Green Belt, Black Belt, and Yellow Belt, as well as LEAN certifications.
Book a Call and Let us know how we can help meet your training needs.


