
Working with large or complex data sets is a common challenge in Six Sigma projects. Excel remains one of the most popular tools for data analysis due to its flexibility, accessibility, and powerful built-in features. However, managing extensive or intricate data in Excel requires specific strategies to avoid performance slowdowns and ensure accurate, efficient analysis.
This article explores the best ways to handle large and complex data in Excel specifically for Six Sigma projects. It guides you through data organization, cleaning, advanced functions, and visualization techniques. By mastering these concepts, you improve your ability to draw meaningful insights and drive process improvements confidently.
Table of contents
Why Large Data Handling Matters in Six Sigma?
Six Sigma projects rely heavily on data to measure process performance, identify defects, and track improvements towards operational excellence. As projects grow in scope, the amount of data becomes larger and more complex.
Efficient data management ensures:
- Fast and accurate calculations
- Clear visibility of key metrics
- Smooth creation of control charts, histograms, and dashboards
- Reliable decision-making backed by clean data
Handling large data well empowers Six Sigma practitioners to harness Excel’s full potential and achieve high-quality results.
Organizing Large Data Sets Efficiently
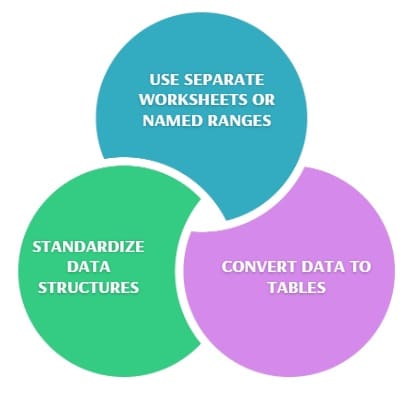
Organization is key when dealing with complex data. Establish these best practices:
- Use Separate Worksheets or Named Ranges: Group different types of data (raw input, intermediate calculations, results) logically on separate sheets or assign named ranges for easier reference.
- Convert Data to Tables: Excel tables automatically adjust ranges and facilitate sorting, filtering, and formulas.
- Standardize Data Structures: Ensure consistent column naming, data types, and formats to reduce errors and speed up formula processing.
Organized data provides a foundation for efficient operations like filtering, sorting, and analysis without crashing Excel.

Public, Onsite, Virtual, and Online Six Sigma Certification Training!
- We are accredited by the IASSC.
- Live Public Training at 52 Sites.
- Live Virtual Training.
- Onsite Training (at your organization).
- Interactive Online (self-paced) training,
Cleaning and Validating Data
Data accuracy is non-negotiable. Apply these methods:
- Data Validation Rules: Restrict data entry to valid ranges or types using Excel’s Data Validation feature.
- Remove Duplicates and Errors: Use built-in tools to cleanse repeated or inconsistent entries.
- Conditional Formatting: Visually highlight potential outliers or missing values that need review.
Cleaning data early prevents errors in statistical calculations and Six Sigma metrics such as DPMO (defects per million opportunities) or sigma levels.
Also Read: How to Apply Six Sigma Tools to Gemba Walks for Process Excellence?
Leveraging Excel’s Advanced Tools for Large Data
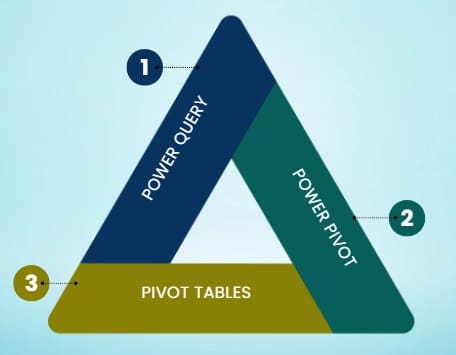
Power Query
Power Query is a powerful tool to connect, cleanse, and transform millions of rows from various sources. It simplifies merging data sets and automating repetitive cleaning.
Power Pivot
Power Pivot handles large volumes by creating efficient data models allowing more sophisticated calculations and relationships than typical spreadsheets. It can compress data and perform rapid analytics ideal for DMAIC projects.
Pivot Tables
PivotTables summarize and analyze large datasets with drag-and-drop ease. They enable quick aggregation, filtering by categories, and insightful breakdowns without complex formulas.
Using Formulas and Functions for Complex Data
- Array Formulas: Perform calculations across multi-cell ranges in a single formula.
- SUMIFS, COUNTIFS: Calculate conditional sums and counts to analyze defects or quality metrics.
- INDEX-MATCH: Retrieve values dynamically without heavy processing.
- Dynamic Arrays and FILTER: Available in newer Excel versions, these simplify extracting and analyzing subsets of complex data.
Using efficient formulas reduces calculation time and simplifies multi-step Six Sigma analysis.
Visualizing Complex Data
Effective visualization aids comprehension and decision-making:
- Control Charts: Monitor process stability using scatter or line charts with control limits.
- Histograms: Understand data distributions critical for identifying variation sources.
- Dashboards: Combine multiple visuals with interactive slicers and conditional formatting for real-time insights.
Excel’s charting tools transform complex data into actionable information for improvement teams.
Also Read: Operational Excellence: A Blueprint for Business Success
Best Practices to Maintain Excel Performance
- Limit Volatile Functions: Minimize use of functions like NOW(), OFFSET(), and INDIRECT() that recalculate often.
- Split Data: Break large datasets into manageable sections or use Excel’s split pane feature.
- Disable Automatic Calculation: Set to manual when making bulk edits to reduce lag.
- Archive Old Data: Keep frequently used files smaller by archiving irrelevant data externally.
Following these tips keeps workflows fast and responsive even with large Six Sigma data projects.
Frequently Asked Questions (FAQs)
How do you handle large or complex data sets in Excel for Six Sigma?
By organizing data smartly, cleaning rigorously, and using Excel tools like Power Query, Power Pivot, and PivotTables effectively.
What Excel features are best for Six Sigma data analysis?
Tables, Data Validation, Power Query, Power Pivot, PivotTables, and advanced formulas like SUMIFS and dynamic arrays.
Can Excel manage millions of rows?
Excel supports up to over one million rows, but performance depends on hardware and how efficiently features like Power Query and Power Pivot are used.
How to improve Excel speed with large datasets?
Avoid volatile functions, disable auto-calculation temporarily, split data, and clean unnecessary content to keep files fast.
Is Excel suitable for complex Six Sigma projects?
Yes, when combined with proper data management strategies and advanced Excel tools. For extremely large datasets, integration with external databases or BI tools might be needed.
Final Words
Handling large or complex data sets in Excel for Six Sigma is achievable with the right approach and tools. Organizing data properly, applying rigorous cleaning, and leveraging advanced features like Power Query and PivotTables unlock Excel’s full potential. Excel remains a flexible platform to analyze large volumes of data, generate meaningful insights, and drive continuous process improvements.


