
In statistics, degrees of freedom (df) represent the number of independent values or quantities that can vary in an analysis without breaking any constraints. It’s a cornerstone concept in statistical tests like the t-test, chi-square test, and ANOVA, determining how much wiggle room your data has to inform conclusions. But what does df mean in statistics, and why does it matter? Let’s break it down.
The degrees of freedom definition ties directly to the idea of constraints. When calculating a statistic, like the mean or variance, some values are “used up” to satisfy certain conditions, reducing the number of values free to vary. For example, if you know the mean of a dataset, one value is fixed once you choose the others, limiting your degrees of freedom.
This article explores the meaning of degrees of freedom, how to calculate them, and their role in statistical tests like the t-test and chi-square. By the end, you’ll know how to find degrees of freedom and why they’re critical for accurate statistical analysis.
Table of contents
What are Degrees of Freedom in Statistics?
In simpler terms, Degrees of freedom or df indicates how many numbers in your dataset are truly free to vary once you’ve applied certain restrictions or calculated specific parameters.
The concept originates from the need to estimate population parameters using sample data. When you calculate statistics from a sample, you impose constraints on your data. Each constraint you add reduces the number of independent pieces of information available for estimating variability and conducting statistical tests.
Think of degrees of freedom as the number of independent pieces of information available to estimate parameters and calculate test statistics. This measure directly affects the shape of probability distributions used in hypothesis testing, influencing critical values and ultimately your statistical conclusions.
Why Degrees of Freedom Matter?
Degrees of freedom are like the unsung heroes of statistical analysis. They ensure your calculations reflect the true variability in your data, preventing over- or underestimation of results. Without df, statistical tests could produce misleading outcomes, leading to incorrect conclusions about your data.
For instance, in a t-test, degrees of freedom determine the shape of the t-distribution, which affects p-values and confidence intervals. Similarly, in a chi-square test, df helps assess whether observed frequencies differ significantly from expected ones. Understanding what df in statistics means empowers you to interpret these tests correctly.
Moreover, df influences the critical values in statistical tables, such as the degree of freedom chart for chi-square or t-tests. These tables guide researchers in deciding whether results are statistically significant. So, let’s dive into how to calculate degrees of freedom for various statistical methods.

Public, Onsite, Virtual, and Online Six Sigma Certification Training!
- We are accredited by the IASSC.
- Live Public Training at 52 Sites.
- Live Virtual Training.
- Onsite Training (at your organization).
- Interactive Online (self-paced) training,
How to Calculate Degrees of Freedom?
Calculating degrees of freedom depends on the statistical test and the structure of your data. Below, we’ll explore the degrees of freedom formula for common scenarios, including t-tests, chi-square tests, and ANOVA.
Degrees of Freedom for a Sample Mean
When calculating the sample mean, you sum all observations and divide by the sample size (n). If you have n observations, you can freely choose n-1 values, but the last value is fixed to satisfy the mean. Thus, the degree of freedom formula for a sample mean is:
df = n – 1
For example, if you have a sample of 10 students’ test scores, the degrees of freedom for calculating the sample variance or standard deviation is 10 – 1 = 9.
Also Read: Bayesian Statistics
How to Calculate Degrees of Freedom for Different Statistical Tests
Degrees of Freedom in T-Tests
T-tests compare means between groups, and calculating df varies slightly depending on the test type.
One-Sample T-Test: For comparing a sample mean to a known population value:
- df = n – 1
Independent Samples T-Test (Equal Variances): When comparing means from two independent groups:
- df = n₁ + n₂ – 2
This formula reflects that you’re estimating two means (one constraint per group), reducing total observations by two.
Paired Sample T-Test: For matched pairs or repeated measures:
- df = n – 1
Here, n represents the number of pairs, and you’re essentially analyzing difference scores between paired observations.
Two-Sample T-Test (Unequal Variances): Also called Welch’s t-test, this uses a more complex calculation:
- df = [(s₁²/n₁ + s₂²/n₂)²] / [(s₁²/n₁)²/(n₁-1) + (s₂²/n₂)²/(n₂-1)]
This Welch-Satterthwaite equation typically produces non-integer df values, which statistical software handles appropriately.
Degrees of Freedom in Chi-Square Tests
Chi-square tests examine relationships between categorical variables or goodness-of-fit, with df calculations based on table dimensions.
Chi-Square Goodness-of-Fit Test:
- df = k – 1
Where k equals the number of categories. You subtract one because knowing frequencies in k-1 categories and the total determines the final category’s frequency.
Chi-Square Test of Independence: For contingency tables analyzing relationships between two categorical variables:
- df = (r – 1) × (c – 1)
Where r represents the number of rows and c represents the number of columns. This formula accounts for constraints imposed by row and column totals.
Example: A 3×4 contingency table has df = (3-1) × (4-1) = 2 × 3 = 6
Degrees of Freedom in ANOVA
In ANOVA (Analysis of Variance), degrees of freedom split into two parts: between groups and within groups.
- Between-groups df: This is k – 1, where k is the number of groups. For three treatment groups, df = 3 – 1 = 2.
- Within-groups df: This is N – k, where N is the total sample size across all groups. For 30 total participants across three groups, df = 30 – 3 = 27.
- Total df: This is N – 1, the total sample size minus one.
ANOVA degrees of freedom help partition variability, allowing you to test whether group means differ significantly.
How to Determine Degrees of Freedom?
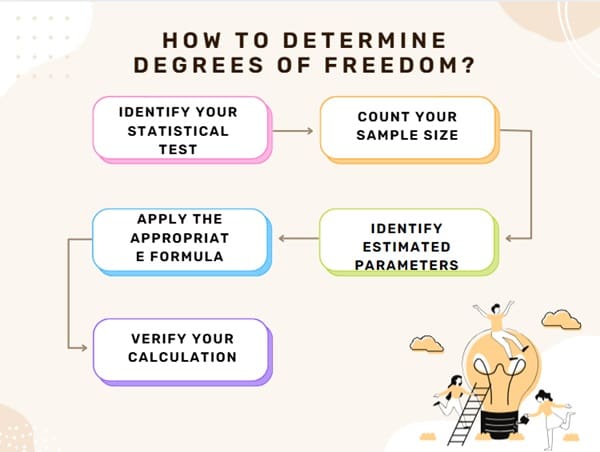
Finding degrees of freedom systematically involves these steps:
Step 1: Identify Your Statistical Test Different tests require different df calculations. Clearly establish whether you’re conducting a t-test, chi-square test, ANOVA, or regression analysis.
Step 2: Count Your Sample Size Determine n (total observations) or, for multi-group tests, individual group sizes. Accurate counting forms the foundation of correct df calculation.
Step 3: Identify Estimated Parameters Count how many population parameters you’re estimating from sample data. Common parameters include means, variances, proportions, and regression coefficients.
Step 4: Apply the Appropriate Formula Use the formula corresponding to your specific test, ensuring you account for all constraints and estimated parameters.
Step 5: Verify Your Calculation Cross-check your result against expected ranges. Extremely high or low df values might indicate calculation errors
Also Read: Inferential Statistics: Definition, Types, Formulas & Examples
Examples
Let’s make this concrete with real-world examples.
Example 1: T-Test for Student Performance
Suppose a teacher compares test scores of two classes (20 students each) to see if one outperforms the other. Using an independent two-sample t-test with equal variances, the t-test df is:
df = n₁ + n₂ – 2 = 20 + 20 – 2 = 38
This df value determines the critical t-value for assessing significance.
Example 2: Chi-Square Test for Survey Data
Imagine a survey asking 100 people to choose between four music genres. To test if preferences match an expected distribution, use a chi-square goodness-of-fit test. The degrees of freedom for chi-square are:
df = k – 1 = 4 – 1 = 3
This df guides you to the correct chi-square critical value.
Example 3: ANOVA for Marketing Campaigns
A company tests three marketing strategies with 10 participants each. In ANOVA, calculate:
- Between-groups df: 3 – 1 = 2
- Within-groups df: 30 – 3 = 27
- Total df: 30 – 1 = 29
These values help determine if the strategies yield significantly different results.
Common Pitfalls and Tips
Calculating degrees of freedom can trip up even seasoned researchers. Here are common mistakes and how to avoid them:
- Misidentifying the test type: Ensure you know whether you’re using a one-sample, paired, or two-sample t-test, as each has a different df formula.
- Forgetting constraints: In chi-square tests, remember that df accounts for fixed totals (e.g., row or column sums in contingency tables).
- Relying on software without understanding: Tools like R or Excel compute df automatically, but understanding the logic ensures you interpret results correctly.
To calculate degrees of freedom accurately, double-check your sample size and test parameters. If unsure, consult a degree of freedom chart or statistical software documentation.
FAQs About Degrees of Freedom in Statistics
What is a degree of freedom in statistics?
A degree of freedom (df) is the number of independent values in a statistical analysis that can vary without violating constraints. It’s crucial for tests like t-tests and chi-square.
How do you calculate degrees of freedom for a t-test?
For a one-sample or paired t-test, df = n – 1, where n is the sample size or number of pairs. For a two-sample t-test with equal variances, df = n₁ + n₂ – 2.
How do you find degrees of freedom for a chi-square test?
For a goodness-of-fit test, df = k – 1, where k is the number of categories. For a test of independence, df = (r – 1)(c – 1), where r and c are the number of rows and columns.
Why do degrees of freedom matter in ANOVA?
In ANOVA, degrees of freedom split into between-groups (k – 1) and within-groups (N – k) to assess variability, helping determine if group means differ significantly.
What does df stand for in stats?
Df stands for degrees of freedom, representing the number of independent values free to vary in a statistical calculation.
Final Words
Degrees of freedom in statistics are more than just a number—they’re the key to unlocking accurate, reliable results in tests like t-tests, chi-square, and ANOVA. By understanding what degrees of freedom are, how to calculate them, and their role in various tests, you gain the power to interpret data with confidence.


