Visual management transforms how organizations function by condensing complex data into visual cues that everyone can understand.
By making information visible and accessible, companies can improve communication, streamline processes, and drive continuous improvement. Visual management stands out as a revolutionary solution that brings unprecedented transparency and collaboration into the workplace.
Table of contents
- What is Visual Management?
- Key Principles of Visual Management
- Benefits of Visual Management
- Standardization
- Visual Controls in the Workplace
- Purpose of Visual Controls
- Visual Management Tools and Controls
- Techniques and Applications
- Case Study: Visual Control in the Wood Furniture Industry
- Visual Management Boards
- Gemba Walks (Gumbaka in Japanese)
- Example
- Guidelines for Visual Management
- Final Words
- Related Articles
What is Visual Management?
Visual management is an approach designed to increase efficiency and effectiveness by making key information more visible. Many firms utilize visual signals in the form of kanban boards, heijunka boxes or coloured wear for team identification as visual signals for quick recognition of important data.
Visual management is a communication tool used to provide an in-depth snapshot of manufacturing operations. It aims to translate shop floor processes and production statuses into easily comprehendible visual overviews – something an electronic scoreboard can do.
Public, Onsite, Virtual, and Online Six Sigma Certification Training!
- We are accredited by the IASSC.
- Live Public Training at 52 Sites.
- Live Virtual Training.
- Onsite Training (at your organization).
- Interactive Online (self-paced) training,
Types of Visual Management
Visual management takes many different forms that adhere to lean methodology:

- Factory Layout: Visual management in factory layouts involves tools such as FIFO lanes to make workflows more intuitive. Assembly lines are organized using visual indicators at key points so operators can identify their stage in production by their station number.
- Tools and Parts: Utilizing Kaizen foams and shadow boards, visual management ensures tools are easy to locate and store. Each one has a designated location so it is evident if anything goes missing or where they should be returned after use.
- Markings: Labels and markings can be found throughout a shop floor to guide activities, locate items, and indicate restricted areas. Many of these markings are government-mandated safety measures but also serve as essential guides for operators.
- Data Displays: Digital information displays, like Andons and dashboards, are often deployed across a shop floor to display key performance indicators (KPIs). They offer real-time analytics on shop performance as they keep everyone aware of its status and advancement.
Functions of Visual Management

Share Information
One key purpose of visual management is sharing information quickly and efficiently, such as dashboards, workplace markings, or lights providing instant updates on production status, work progress, or important notices.
Develop Work Standards
By tracking and displaying information regarding ongoing work, visual management helps establish work standards. For instance, recording tasks and processes allows you to set a standard pace while clearly outlining each process step.
Share Work Standards
Once work standards have been set, visual management ensures they are effectively communicated to everyone involved. Displaying these standards within the workplace through visual cues helps everyone to understand the necessary procedures and performance expectations.
Highlight Problems
Integrated systems alert supervisors and workers instantly whenever something goes amis, giving them time to respond immediately without constant monitoring of a problem.
Solve Problems
Proper visual management can be a valuable way to prevent and solve issues. By offering clear instructions and guidelines, visual cues help ensure processes are followed correctly thereby minimizing errors and increasing efficiency.
Also Read: What is Visual Factory?
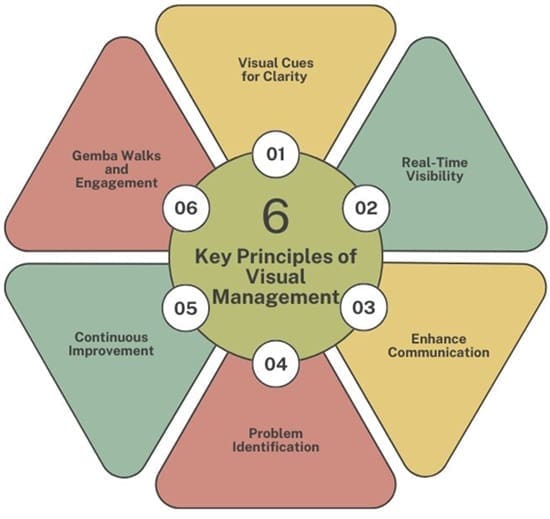
Key Principles of Visual Management

Visual Cues for Clarity
Visual management employs visual aids such as charts, boards, indicators and color-coded systems to communicate information quickly. By replacing cumbersome text-based content with easily understandable images and videos, all members of an organization can quickly grasp key insights and updates quickly and easily.
Real-Time Visibility
Kanban boards provide real-time visibility into processes, progress and performance allowing teams to monitor tasks efficiently while quickly identifying bottlenecks and making informed decisions quickly.
Enhance Communication
Visual cues bridge language barriers and allow organizations to optimize communication among departments, shifts, and locations more efficiently by eliminating miscommunication and increasing alignment. By employing visuals in this manner, organizations reduce miscommunication while improving alignment.
Problem Identification
Visual management identifies any deviations from standard processes or performance targets, including any issues or delays which become immediately obvious, prompting swift action and problem-solving solutions to be put in place immediately.
Continuous Improvement
Visual reminders serve as constant reminders of goals, standards and objectives. Their constant visual presence encourages teams to remain committed to continuous improvement while adhering to Lean principles.
Gemba Walks and Engagement
Gemba walks provide leaders and employees the chance to observe operations first-hand and engage with one another directly on site, giving leaders the ability to identify waste sources as well as gain insights from frontline workers. This hands-on approach fosters direct engagement between all involved, giving leaders direct access to gathering intelligence from frontline workers.
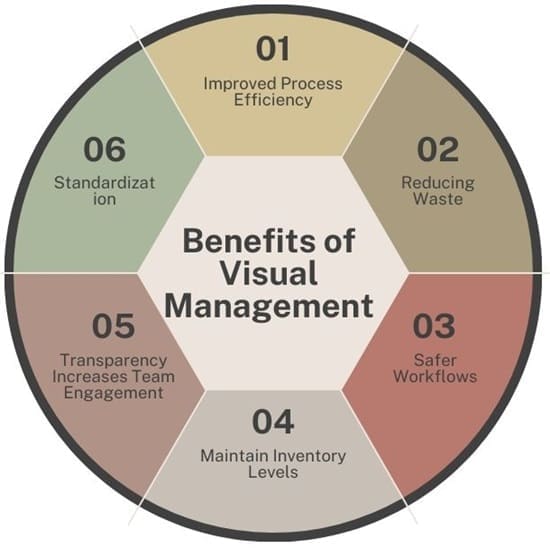
Benefits of Visual Management
Employing visual management consistently can dramatically enhance manufacturing operations. Here are a few key advantages:

- Improved Process Efficiency: Visual management helps streamline processes by making information easily accessible and understandable, cutting the amount of time spent searching for it and speeding up decision-making processes, increasing overall efficiency.
- Reducing Waste: By making inefficiencies visible, visual management allows companies to identify and eliminate all eight categories of lean waste – defects, overproduction, waiting time, non-utilized talent, transportation cost, inventory issues, motion concerns and extra processing – thus leading to more cost-efficient operations and improving efficiencies overall.
- Safer Workflows: Floor markings, safety signs and colour-coded indicators can play an invaluable role in workplace safety, alerting employees of potential dangers while reinforcing protocols aimed at reducing accidents and injuries.
- Maintain Inventory Levels: Visual management plays a critical role in maintaining optimal inventory levels. By clearly displaying inventory statuses and production needs, visual management helps ensure stock levels match production needs – thus preventing overstocking or stockouts from occurring.
- Transparency Increases Team Engagement: Team members feel more engaged and informed when information is made accessible easily and transparently, creating an environment of cooperation and accountability within an organization, and leading to higher engagement levels among employees. Visual management creates this culture for greater employee motivation and retention.
Also Read: What is Work Breakdown Structure?
Standardization
Standardization in Lean practices refers to the deliberate development and implementation of uniform processes, procedures, and best practices throughout an organization in order to minimize variability, increase predictability, and ensure tasks are performed consistently and efficiently.
It also forms the foundation for continuous improvement by providing organizations with a benchmark from which they can analyze, refine, and optimize their operations.
Visual Controls in the Workplace
Major Types of Visual Controls for Businesses
- Information: For questions like, “What is this?, “Where am I?, and “Who works here?.”
- Instruction: Guides as to “What should I do and How do I do it”.
- Status: Indicates the current state of a process, machine or department by answering questions such as “What is happening?” and “What should happen?”.
Purpose of Visual Controls
The goal of visual management is to enhance efficiency and effectiveness of processes by making their steps more visible. According to this theory, having something visible makes it easier for us to remember it and stay aware of its purpose; visual signals also ensure all parties involved share the same understanding.
Also See: MBA vs. Six Sigma: Which Should You Choose?
Visual Management Tools and Controls
A Lean production system relies on visual management tools and controls for maximum efficiency, creating a work environment where processes can be seen without needing words to explain them.
They help identify problems, reduce waste, cut costs, shorten lead times, lower inventory levels, enhance safety measures, increase safety precautions, and potentially boost profits. Here are some common visual management tools:

Color Coding
The use of colors as indicators to indicate status and actions is an efficient way of standardizing communication across the workplace, from tool boards and floor markings to office documents and shadow boards, helping employees quickly understand what comes next.
Andon Lights
Andon systems alert management, maintenance, and operators of quality or process issues. When something arises that needs fixing, workers can manually activate an Andon to temporarily stop production until it’s resolved; this process can also address part shortages, defects, malfunctions or safety concerns.
Standard Work
Standard Work outlines the most efficient and consistent method to complete tasks, with respect to efficiency and consistency. It includes:
- Content: Agreed steps involved in a task.
- Sequence: Steps completed in the same order every time.
- Timing: Standard time to complete tasks.
- Outcome: Clear definitions of quality, safety, and output.
Floor Line Marking & Signage
Floor markings and signage indicate pathways, vehicle lanes, work cells, and intersections. They enhance safety and streamline material and people flow without disrupting production.
Kamishibai Boards and Tee Cards
Using red/green cards, these tools allow quick visual checks on task completion with quick visual checks that show whether tasks have been completed successfully. Furthermore, these boards show whether the board is currently being used and log any potential issues encountered.
Kanban boards
It provide a visual display of workflow and task status using cards moving across columns to represent stages in the process, helping identify bottlenecks, balance demand with capacity and ensure transparency within an organization.
Huddle Boards
Huddle boards can help team meetings run more efficiently by showing progress, issues and improvements at a glance. Their primary purpose is to focus on team goals and continuous improvement by giving a more comprehensive view of performance metrics.
Quality Standards
Quality standards provide operators with a guide for decision-making, reducing defects and inspection needs while assuring products meet specific criteria.
Techniques and Applications
Organizational Tool for Materials: Labeled storage boards provide clear indication of where tools belong and any that might be missing, while posting reminders on cubicle walls ensures they stay visible at all times.
Safety and Decision-Making: Visual signs and signals provide the essential information required for informed decision-making when it comes to safety or problem resolution.
Case Study: Visual Control in the Wood Furniture Industry
An assembly process wherein PVC and metal components were incorrectly assembled due to communication gaps, memory problems, and workers lacking understanding of product drawings was problematic.
Solution
Implementing Visual Control Techniques by Converting Product Drawings into Electronic Multimedia Files.
- Convert drawings into PowerPoint presentations.
- Use color coding to distinguish different insertions (e.g., PVC 5mm, PVC 8mm, Metal).
- Create short movie clips for different products.
- Display these clips on LED screens at the workplace.
Implementation and Results
Implementation: LED displays show movie clips, allowing workers to follow visual instructions.
Results: Reduced mistakes, flawless insertion processes, and improved product quality.
Visual Management Boards
- Indicate the status of the process.
- Direct leadership to areas needing support.
- Show actions or countermeasures in progress.
- Highlight normal versus abnormal conditions.
Gemba Walks (Gumbaka in Japanese)
Designed to assist leaders in recognizing potential safety hazards, inspecting machinery and equipment conditions, gaining insight into practiced standards, understanding work status as well as building relationships with employees. Their purpose is to gain an understanding of value chains and its problems.
Example
- Haldan MES System collects Overall Equipment Effectiveness (OEE) data to present important information at multiple organizational levels.
- Hansens Engineering found several benefits during its testing phase: reduced meetings, motivated staff, rapid problem identification, strategic decision-making support and accountability for performance.
- Automation Pyramid: The automation pyramid illustrates how data collected at lower levels can be processed into valuable information to aid decision-making and resource allocation. Faster information processing at lower levels facilitates faster responses and improvement adjustments.
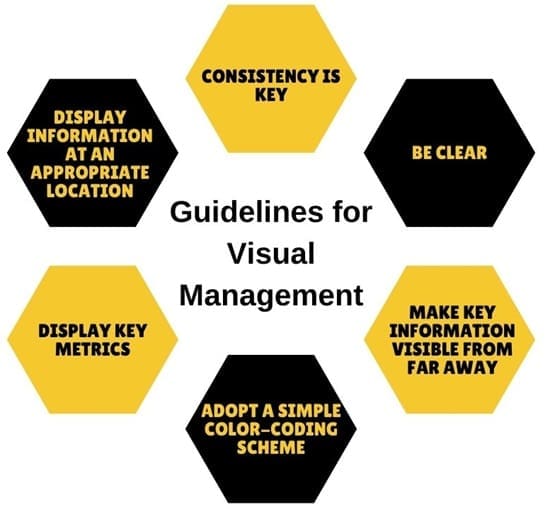
Guidelines for Visual Management

Consistency Is Key
To maximize its impact and minimize confusion and make information more readily understood and actionable, make sure all instances where you use a visual management tool use similar colors, symbols and formats – this way avoiding any potential for misinterpretation of information.
Be Clear
Communicate information clearly and simply. Employ simple language, uncluttered symbols and fonts for ease of reading; avoid overloading users with too much data which could overwhelm and confuse them.
Make Key Information Visible from Far Away
It is crucial that crucial information can be seen clearly from a distance of up to 40 feet, so using large fonts, bright colors, and strategic placement to increase its visibility enables workers to quickly access vital info without needing to be close by.
Adopt a Simple Color-Coding Scheme
Employ a universally understood color coding system where green indicates positive outcomes such as meeting or exceeding targets while red indicates any missed ones; this helps quickly convey status and performance levels.
Display Key Metrics
Show essential metrics such as people, quality, schedule, cost and 5S (Sort, Set in order, Shine Standardize Sustain). This provides employees with an overall look at performance and helps keep their focus on key areas which impact productivity and efficiency.
Display Information at an Appropriate Location
Make sure that information is placed where it will best serve its recipients. For instance, place performance metrics where all team members can see them, while specific process instructions should be placed directly at workstations where needed – this makes the information accessible and actionable.
Final Words
Visual management and standardization are central elements of Lean practices, creating an environment of transparency, consistency and continuous improvement.
Visual cues improve communication and problem identification while standardization promotes predictability and efficient training. Adopting these principles creates an atmosphere in which waste can be reduced while value creation maximized, and operational excellence becomes a sustainable reality.

About Six Sigma Development Solutions, Inc.
Six Sigma Development Solutions, Inc. offers onsite, public, and virtual Lean Six Sigma certification training. We are an Accredited Training Organization by the IASSC (International Association of Six Sigma Certification). We offer Lean Six Sigma Green Belt, Black Belt, and Yellow Belt, as well as LEAN certifications.
Book a Call and Let us know how we can help meet your training needs.


