

Table of contents
Estimated reading time: 7 minutes
What Is Variable Data?
Variable data, often referred to as continuous data, encompasses information or data that exhibits variability within a dataset or set of records, in stark is whats contrast to static or fixed data, which remains constant across entries or records. Variables in statistics signify data acquired through measurements, spanning dimensions like length, time, diameter, strength, weight, temperature, density, thickness, pressure, and height. What sets data apart is its capacity to assume diverse values and the precision of these measurements that can be determined by what is it.
Where Can It Be Used?
For instance, data can measure an object to the nearest centimeter, millimeter, or micron, depending on the desired level of accuracy. Essentially, these data represent the outcome of measuring an attribute using an appropriate measuring instrument, such as a scale, tape measure, stopwatch, or the like. This data inherently possesses two characteristics: it can assume any value from a continuous spectrum, and it can be logically subdivided based on the instrument’s resolution.
An Example of Using Variable Data
Discrete or attribute data is characterized by counting rather than measuring. For instance, you can count individuals, boxes, or invoice errors, resulting in discrete values. Talking about one and a half individuals or 1.401 invoice errors lacks practicality or meaning. However, there exists a scenario where you count entities but can treat the data as a form of pseudo-continuous or random data. This circumstance arises when dealing with substantial counts encompassing a broad range of values distributed across that range.
To illustrate, suppose you want to determine the average number of cases of a product produced daily over a month. The act of counting cases daily inherently yields discrete data. In most cases, this count would be substantial. Suppose the daily production varies widely across the range of possible values, and these values are distributed in a way that spans the entire range. In that case, you might choose to treat this data as variable data. In such situations, it becomes appropriate to employ statistical tools designed for the data analysis.
What’s Variable Data in Statistics?
In statistics, the data refers to data that can take on different values or observations within a dataset. These values can vary from one individual or item to another. Variable data is information that can be measured or observed and is what exhibits differences or variations among the data points.
These are fundamental concepts in statistics because form the basis for data analysis, hypothesis testing, and modeling. Researchers and analysts often collect data to gain insights, make inferences, and draw conclusions about populations or phenomena that are of interest. Understanding the types and nature of these data is essential for choosing appropriate statistical techniques and conducting meaningful statistical analyses.
Types of Variable Data in Statistics
In statistics, variables are whats typically categorized into two main types: qualitative variables and quantitative variables (numerical). Each of these categories can be further subdivided. Here are the main types of these in statistics:
- Categorical data represents groupings.
- Quantitative data represents amounts.
Qualitative Variables (Categorical Variables):
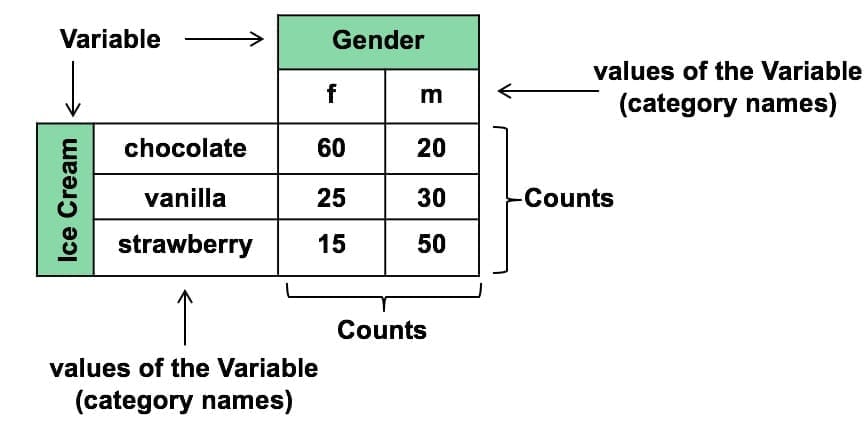
- Nominal: These represent categories or labels with no inherent order. Examples include gender (male, female), colors (red, blue, green), or types of fruits (apple, banana, orange).
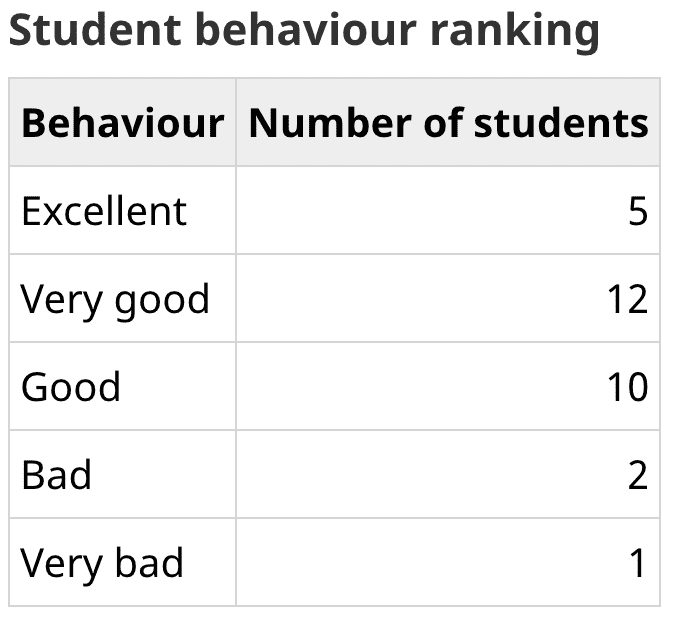
- Ordinal: These represent categories with a meaningful order or ranking, but the intervals between categories are not necessarily equal. Examples include survey responses (e.g., “very dissatisfied,” “neutral,” “very satisfied”) or education levels (e.g., high school, bachelor’s degree, master’s degree).
Quantitative Variables (Numerical Variables):
- Discrete Variables: Discrete numbers take on specific, distinct values, often in the form of whole numbers. Examples include the number of students in a classroom, the count of cars in a parking lot, or the number of goals scored in a soccer game.
- Continuous Variables: These can take on any value within a range, and they often involve measurements. Examples include height, weight, temperature, age, and income. It can be further categorized into:
- Interval Variables: Interval variables have values that are measured on a scale with equal intervals between them, but they lack a true zero point. Examples include temperature measured in Celsius or Fahrenheit.
- Ratio Variables: Ratio variables have values that are measured on a scale with equal intervals between them and a meaningful zero point. Examples include age, weight, height, income, and distance.
- Binary Variables: Binary variables have only two possible outcomes or categories, often represented as 0 and 1. Examples include yes/no responses, success/failure outcomes, or the presence/absence of a characteristic.
These types are fundamental in statistical analysis because they influence what choice is appropriate for statistical methods, such as descriptive statistics, hypothesis testing, and regression analysis. Understanding the nature of it being studied is crucial for drawing meaningful conclusions from statistical data and conducting effective data analysis.
Example of the Types of Variables

A variable represents any attribute, figure, or quantity that is subject to measurement or enumeration. These encompass a wide range of characteristics, such as age, gender, financial income and expenditures, country of origin, capital investments, academic grades, eye pigmentation, or vehicle categories.
For instance, in an experiment aimed at assessing the salt tolerance of various plant species, you would identify crucial for monitoring it. These may include the quantity of salt introduced into the water and the specific plant species under investigation, and these are about plant well-being, such as growth rate and susceptibility to wilting.
It is imperative to understand the nature of it involved in your study, as this knowledge informs the selection of appropriate statistical tests and the interpretation of research findings.
A real-world example
Case: Studying Factors Affecting Exam Scores
Suppose a researcher is conducting a study to understand the factors that influence students’ exam scores in a math class. In this study, various types of these can be identified:
- Dependent Variable (Quantitative): What’s the variable in this case? These would be the students’ exam scores, which are numerical measurements. Each student’s score can vary, making it a quantitative variable.
- Independent Variables (Qualitative and Quantitative): The researcher may consider several independent variables, including both qualitative and quantitative types:
- Qualitative Independent Variable: Gender (male or female) is an example of a qualitative independent variable. It’s categorical data representing a characteristic.
- Quantitative Independent Variable: The number of hours spent studying for the exam is a quantitative independent variable. It represents a numerical quantity.
- Covariate (Quantitative): The student’s previous math grades can be considered as a covariate. It’s a quantitative that could potentially influence exam scores.
- Control Variable (Qualitative): The type of study materials used (e.g., textbook, online resources, tutor) could be it. It’s qualitative and categorical because it represents different categories of study materials.
In this study, the researcher aims to determine if variables like gender, study hours, and previous math grades have an impact on the student’s exam scores. They will use various statistical tests and analyses, depending on the nature of each variable, to assess these relationships.

About Six Sigma Development Solutions, Inc.
Six Sigma Development Solutions, Inc. offers onsite, public, and virtual Lean Six Sigma certification training. We are an Accredited Training Organization by the IASSC (International Association of Six Sigma Certification). We offer Lean Six Sigma Green Belt, Black Belt, and Yellow Belt, as well as LEAN certifications.
Book a Call and Let us know how we can help meet your training needs.


