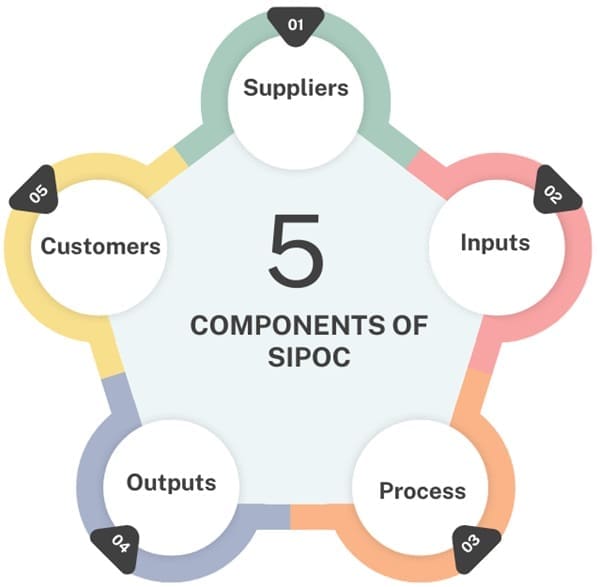
A SIPOC diagram provides a high-level view of a process. The acronym SIPOC stands for Suppliers, Inputs, Process, Outputs, and Customers. This diagram helps visualize and understand the entire process from start to finish. It outlines key elements in the process that need to be considered for quality improvement.
In Six Sigma, SIPOC is used to ensure that every process step adds value to the customer. The aim is to focus on quality throughout the value chain, not just at one point, such as the production or distribution stage. This approach helps organizations improve their processes and meet customer expectations.
Table of contents
History and Evolution of SIPOC
Process improvement is not a new concept. Dr. Edward Deming and the Total Quality Management (TQM) movement in the 1940s pioneered its origins.
Deming’s groundbreaking work emphasized that manufacturing processes should be viewed as integrated systems rather than isolated activities. His work led to creating a systems diagram, which later influenced the development of tools like SIPOC.
Although Peter R. Scholtes is often credited with SIPOC in his book The Leader’s Handbook, Deming’s ideas on system thinking form its foundation. SIPOC diagrams simplify the understanding of complex processes by providing a quick overview of the main components—suppliers, inputs, the process itself, outputs, and customers.
What is a SIPOC Diagram?
A SIPOC diagram is a visual representation that illustrates the flow of information or materials in a process, from start to finish. By mapping out the relationship between suppliers, inputs, processes, outputs, and customers, SIPOC provides a broad overview of a process, making it easier to identify areas that need improvement.
Components

- Suppliers: These are the entities that provide the necessary inputs for a process. They can be individuals, departments, organizations, or even systems that supply raw materials, data, or services.
- Inputs: These are the resources, materials, or information required to execute the process. Inputs can range from raw materials to data, instructions, or software.
- Process: This represents the set of actions or steps that transform the inputs into outputs. The process is the core of the SIPOC diagram and is where value is added.
- Outputs: These are the results or products that come out of the process. Outputs are what the process delivers after transforming inputs.
- Customers: These are the recipients of the outputs. They could be internal or external to the organization and may be individuals, teams, or external clients who use the outputs.
A SIPOC diagram provides a high-level view of a process, making it easier to see how these five elements interact and how each one impacts the others.
Video
Requirements for a Good SIPOC Diagram
A successful SIPOC diagram requires a few essential components:
- Clearly Defined Start and End Points: The process boundaries must be defined to avoid confusion.
- Key Process Metrics: Establish how the process will be measured and evaluated. These metrics will help track improvements.
- Identified Process Owners: Determine who is responsible for each part of the process.
- Identified Suppliers and Inputs: Understand who supplies the inputs and what is needed to complete the process.
- Identified Customers and Outputs: Recognize who the customers are and what outputs they expect.
- Stakeholder Requirements: Ensure that all stakeholders’ needs are considered, and success is measured accordingly.
Example
Let’s consider a simple example of making pizzas to understand SIPOC. The steps in the process include taking orders, making pizzas, delivering orders, and collecting payment.
- Suppliers: The suppliers in this case would be the sources of dough, cheese, vegetables, meats, equipment, and packaging.
- Inputs: Inputs are the raw materials like dough, cheese, and toppings. Other inputs include equipment such as ovens and payment systems.
- Process: The process involves taking the order, preparing the pizza, and delivering it.
- Outputs: The output is the pizza and beverages delivered to the customer.
- Customers: Customers could be individuals, businesses, or party organizers who place orders for pizzas.
Purpose of a SIPOC Diagram

SIPOC diagrams help to visualize the flow of materials, information, and work in a process. They are particularly useful for:
- Defining Process Boundaries: SIPOC helps clarify the start and end points of a process. It ensures that all stakeholders understand what is included in the scope and what is not.
- Identifying Key Relationships: The diagram illustrates the connections between suppliers, inputs, processes, outputs, and customers. It helps identify dependencies and areas that may need improvement.
- Assessing Performance: By understanding the inputs and outputs, SIPOC allows organizations to assess how well a process is performing. It also helps identify bottlenecks or inefficiencies.
- Ensuring Alignment: SIPOC ensures all stakeholders align with the process goals and understand their role in contributing to the value chain.
Benefits of Using a SIPOC Diagram

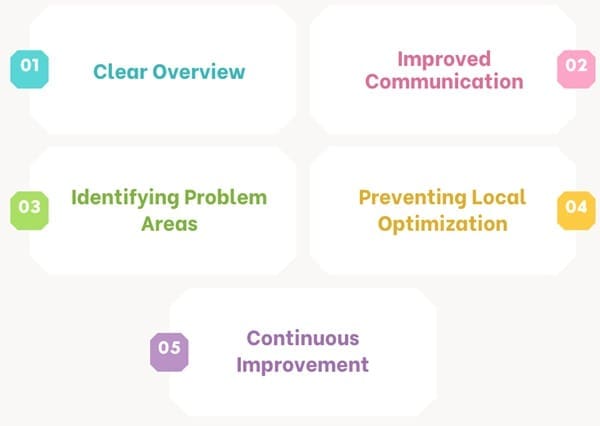
- Clear Overview: A SIPOC diagram offers a simple and high-level view of the entire process. This clarity is important for understanding how various steps are connected and how each step impacts the overall outcome.
- Improved Communication: Since SIPOC provides a visual representation, it improves communication between different stakeholders. Everyone can easily see the flow of work and their role in the process.
- Identifying Problem Areas: SIPOC can help identify weak spots in the process. By visualizing the relationship between inputs and outputs, organizations can detect where improvements are needed.
- Preventing Local Optimization: SIPOC highlights the importance of looking at the entire value chain. Focusing on one part of the process without considering others can lead to inefficiencies. SIPOC ensures that all parts of the process contribute to the overall value.
- Continuous Improvement: SIPOC helps organizations focus on the process and make data-driven decisions. Regular evaluation helps refine processes and enhance overall performance.
SIPOC and Process Improvement
The SIPOC diagram plays a crucial role in process improvement initiatives. It helps organizations define their processes clearly before diving into detailed analysis or data collection. By using a SIPOC, process improvement teams can:
- Define the scope: SIPOC helps teams set clear boundaries for what is included in the process and what is not. This is important to avoid scope creep during process analysis.
- Clarify process dependencies: The diagram shows how different parts of the process are linked together, helping identify potential bottlenecks or inefficiencies.
- Provide a baseline: SIPOC offers a snapshot of the process, which serves as a baseline for measuring improvements over time.
- Align stakeholders: By showing all relevant elements of a process, SIPOC ensures that everyone involved in the improvement project has a shared understanding of the process.
SIPOC is particularly useful during the Define phase of the DMAIC methodology. At this stage, teams are gathering information and trying to understand the existing process. By using SIPOC, they can create a map that highlights the major components of the process and ensures everyone is on the same page before proceeding to data collection or analysis.
SIPOC Process

Creating a SIPOC diagram involves several straightforward steps:
- Identify the Process: Begin by clearly defining the process you want to map. This could be anything from a high-level business function to a specific departmental task.
- Define the Suppliers: Identify all the suppliers that provide the necessary inputs to the process. Suppliers may include departments, external vendors, or systems that deliver the resources needed to complete the process.
- Identify the Inputs: List the inputs required to execute the process. Inputs could be raw materials, data, tools, or other resources that are essential to completing the process.
- Map the Process: Outline the major steps or stages involved in the process. This should be a high-level overview, rather than a detailed map of every step. Focus on the core activities that transform inputs into outputs.
- Determine the Outputs: Identify the results or products that come out of the process. Outputs can include tangible products, services, or other deliverables that are produced as a result of the process.
- Identify the Customers: List the customers who receive the outputs. These could be internal teams, external clients, or other stakeholders who benefit from the process.
Also See: Lean Six Sigma Certification Programs, Chesapeake, Virginia
SIPOC vs. Other Process Tools
While SIPOC diagrams are widely used for process mapping, they are just one of many tools available for process analysis. Tools like Business Impact Analysis (BIA), Value Stream Mapping (VSM), and Flowcharts can also help organizations assess their processes.
SIPOC vs. BIA
Business Impact Analysis (BIA) is a tool often used in business continuity planning to assess the potential impact of disruptions to critical business functions. While BIA focuses on evaluating risks and financial impacts, SIPOC focuses on understanding the flow of materials and information within a process.
SIPOC is often seen as more intuitive and less time-consuming than BIA, especially when quick results are needed for process improvement.
SIPOC vs. Value Stream Mapping
Value Stream Mapping (VSM) is another tool used to analyze processes, particularly in lean management. While SIPOC provides a broad overview of a process, VSM goes deeper into identifying waste, bottlenecks, and inefficiencies in the flow of materials or information. VSM is typically more detailed than SIPOC and is used for a more granular analysis of a specific process.
SIPOC vs. Flowcharts
Flowcharts are commonly used to depict the flow of a process in a detailed and sequential manner. While flowcharts can help map out every step in a process, SIPOC focuses on the high-level elements that define the process. SIPOC diagrams provide a more holistic view of the process, making them ideal for initial planning stages in process improvement.
Why Use SIPOC?

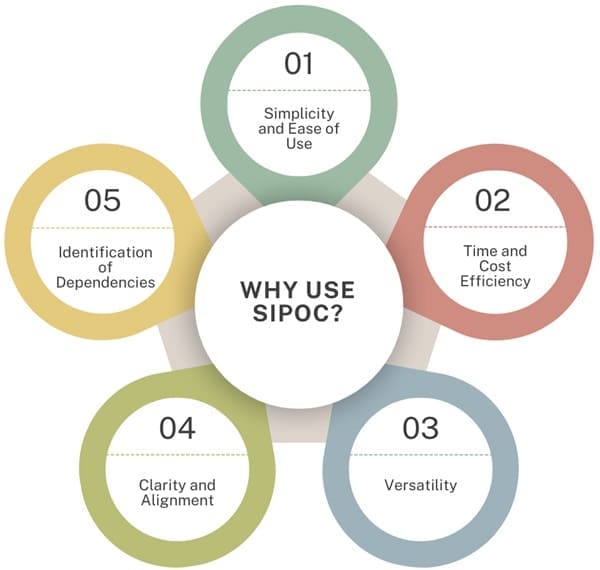
- Simplicity and Ease of Use
One of the greatest advantages of SIPOC is its simplicity. Unlike other tools that may require advanced training or technical expertise, SIPOC is intuitive and easy to understand. Once you know the elements of the diagram, creating a SIPOC is straightforward. - Time and Cost Efficiency
SIPOC diagrams are quick to create, making them a valuable tool when time and resources are limited. In business continuity planning, where the lack of time and resources is often a major challenge, SIPOC can be a faster and more efficient alternative to more traditional tools like BIA. - Versatility
SIPOC is versatile enough to be used in a variety of contexts. It is applicable not only for process improvement and business continuity but also for project management, product development, and service design. The flexibility of SIPOC makes it a valuable tool across multiple industries and organizational levels. - Clarity and Alignment
By clearly mapping out the relationships between suppliers, inputs, processes, outputs, and customers, SIPOC ensures that all stakeholders have a shared understanding of the process. This alignment is critical for successful process improvement efforts and ensures that everyone is on the same page. - Identification of Dependencies
SIPOC diagrams provide a clear view of how processes are interconnected. This can help organizations identify dependencies between processes and pinpoint potential risks or bottlenecks in the system. Understanding these dependencies is key to identifying areas for improvement.
Final Words
The SIPOC diagram is an essential tool in the Six Sigma methodology and business process management. Its simplicity, versatility, and ease of use make it a valuable resource for teams seeking to understand processes, identify improvements, and optimize operations.
By providing a high-level overview of a process, SIPOC helps organizations align stakeholders, define process boundaries, and identify opportunities for improvement.
Whether used for process improvement, business continuity, or project management, SIPOC offers significant value by clarifying the relationships between suppliers, inputs, processes, outputs, and customers.

About Six Sigma Development Solutions, Inc.
Six Sigma Development Solutions, Inc. offers onsite, public, and virtual Lean Six Sigma certification training. We are an Accredited Training Organization by the IASSC (International Association of Six Sigma Certification). We offer Lean Six Sigma Green Belt, Black Belt, and Yellow Belt, as well as LEAN certifications.
Book a Call and Let us know how we can help meet your training needs.


