


How can a Plate of Spaghetti help LEAN your Process?
Table of contentsHow to Draw a Spaghetti DiagramDrawing a Spaghetti DiagramRelated Articles How to Draw a Spaghetti Diagram In LEAN Six Sigma events we use a simple tool called the Spaghetti Diagram to understand the impact of movement. Our goal is to reduce the...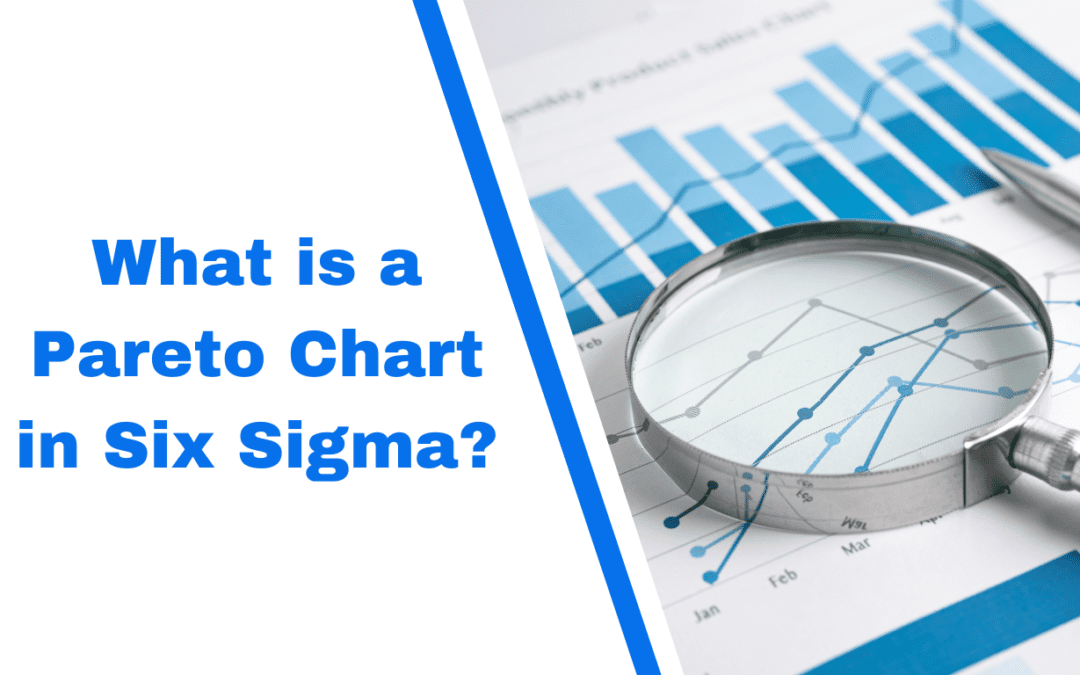
What Is a Pareto Chart in Six Sigma?
Table of contentsWhat is the Pareto Chart in Six Sigma?Primary Elements of The Pareto ChartWhat is the Pareto Principle (or 80/20 Principle)?Origin of the Pareto principle (or 80/20 principle)The Pareto principle (or 80/20 principle) and Lean Six SigmaWhere to use the...
Using the Time Series Plot in Minitab to Show Changes in the Y (or Output)
Table of contentsUsing the Time Series Plot in Minitab to Show Changes in the Y (or Output)Related SSDSI Articles Using the Time Series Plot in Minitab to Show Changes in the Y (or Output) The only way you can quantify the effect on the process that you are trying to...
What is the First Step to Six Sigma Certification?
Table of contents What is the First Step to Certification? How To Avoid This Problem? The First Step What’s Next? Six Sigma Certification: Steps to Become Six Sigma Certified Related SSDSI Articles: What is the First Step to Certification? A quality Lean Six...

ONLINE COURSES:
-
 FAST-TRACK to a Six Sigma Black Belt Certification
$1,996.00
FAST-TRACK to a Six Sigma Black Belt Certification
$1,996.00
-
 Online Lean Six Sigma Black Belt Training & Certification
$998.00
Online Lean Six Sigma Black Belt Training & Certification
$998.00
-
 Online Lean Six Sigma Green Belt Training & Certification
$998.00
Online Lean Six Sigma Green Belt Training & Certification
$998.00
-
 Online Lean Six Sigma Yellow Belt Training & Certification
$498.00
Online Lean Six Sigma Yellow Belt Training & Certification
$498.00
-
 IASSC (International Association for Six Sigma Certification) Practice Exam (100 Questions)
$99.99
IASSC (International Association for Six Sigma Certification) Practice Exam (100 Questions)
$99.99
-
 Lean Six Sigma Green Belt Project Management Kit
Original price was: $298.99.$98.99Current price is: $98.99.
Lean Six Sigma Green Belt Project Management Kit
Original price was: $298.99.$98.99Current price is: $98.99.
-
 Lean Six Sigma Black Belt Project Management Kit
Original price was: $298.99.$98.99Current price is: $98.99.
Lean Six Sigma Black Belt Project Management Kit
Original price was: $298.99.$98.99Current price is: $98.99.
-
 Lean Six Sigma Yellow Belt Project Management Kit
Original price was: $199.98.$58.99Current price is: $58.99.
Lean Six Sigma Yellow Belt Project Management Kit
Original price was: $199.98.$58.99Current price is: $58.99.
-
 Lean Six Sigma SIPOC Diagram Online Training (Complete with Certification)
$29.99
Lean Six Sigma SIPOC Diagram Online Training (Complete with Certification)
$29.99
-
 Lean Six Sigma Value Stream Map Online Training (Complete with Certification)
$29.99
Lean Six Sigma Value Stream Map Online Training (Complete with Certification)
$29.99
-
 Lean Six Sigma Input Map Online Training (Complete with Certification)
$29.99
Lean Six Sigma Input Map Online Training (Complete with Certification)
$29.99
-
 Cause and Effect Matrix Online Training (Complete with Certification)
$29.99
Cause and Effect Matrix Online Training (Complete with Certification)
$29.99
-
 Failure Modes and Effects Analysis Online Training (Complete with Certification)
$29.99
Failure Modes and Effects Analysis Online Training (Complete with Certification)
$29.99
-
 Lean Six Sigma Root Cause Analysis Online Training (Complete with Certification)
$29.99
Lean Six Sigma Root Cause Analysis Online Training (Complete with Certification)
$29.99
-
 Lean Six Sigma Project Charter Online Training (Complete with Certification)
$29.99
Lean Six Sigma Project Charter Online Training (Complete with Certification)
$29.99
-
 FREE Six Sigma White Belt Certification (Online)
Original price was: $99.99.$0.00Current price is: $0.00.
FREE Six Sigma White Belt Certification (Online)
Original price was: $99.99.$0.00Current price is: $0.00.