A Fishbone Diagram, also known as a Cause and Effect Diagram or Ishikawa Diagram, helps identify the root causes of a problem. It serves as a powerful tool for problem-solving.
Named for its resemblance to a fish’s skeleton, this diagram visually maps out all the potential causes that contribute to a specific issue, helping teams brainstorm and systematically approach problem-solving.
Table of contents
What is a Fishbone Diagram?
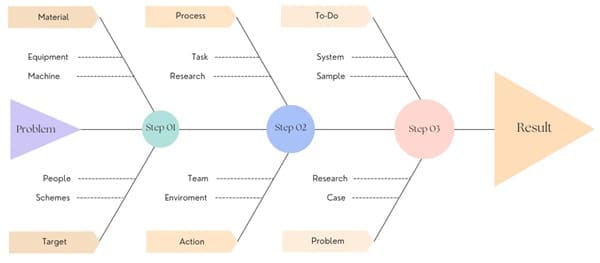
A Fishbone Diagram is a visual tool that systematically identifies the root causes of a problem. Shaped like a fish skeleton, the diagram has a central “spine” with “bones” branching out to represent different categories of potential causes, such as People, Processes, Equipment, Materials, and Environment.
The Fishbone Diagram primarily supports quality management and problem-solving. It helps teams explore all factors contributing to an issue and focuses on addressing root causes rather than symptoms. This approach ultimately leads to more effective solutions.
Origin of the Fishbone Diagram
Kaoru Ishikawa, a Japanese quality management expert, developed the Fishbone Diagram. It helps in root cause analysis. This method is particularly useful in quality control processes where understanding the underlying causes of an issue is critical. The primary goal is to explore all possible reasons for a problem to address them effectively and prevent recurrence.
Structure of the Fishbone Diagram
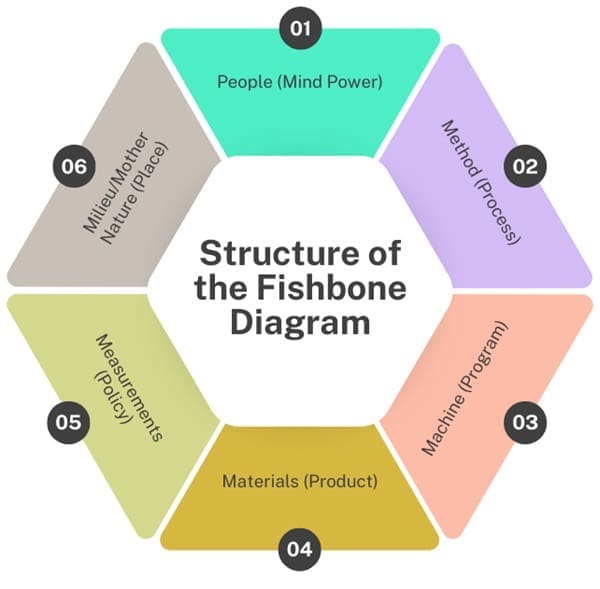
The structure of the diagram resembles a fishbone, with the problem or effect being analyzed placed at the “head” of the fish. From the head, a “spine” extends horizontally, with several “bones” branching out diagonally, each representing different categories of causes.
These categories often include elements like:
- People (Mind Power): Human factors such as team skills, communication, and staff availability.
- Method (Process): Processes, procedures, or workflows that could be contributing to the problem.
- Machine (Program): Equipment or technology issues, including software and hardware.
- Materials (Product): The materials or inputs used in the process.
- Measurements (Policy): Data collection methods, policies, and how results are measured.
- Milieu/Mother Nature (Place): Environmental or external factors, such as weather or location.
When to Use a Fishbone Diagram?
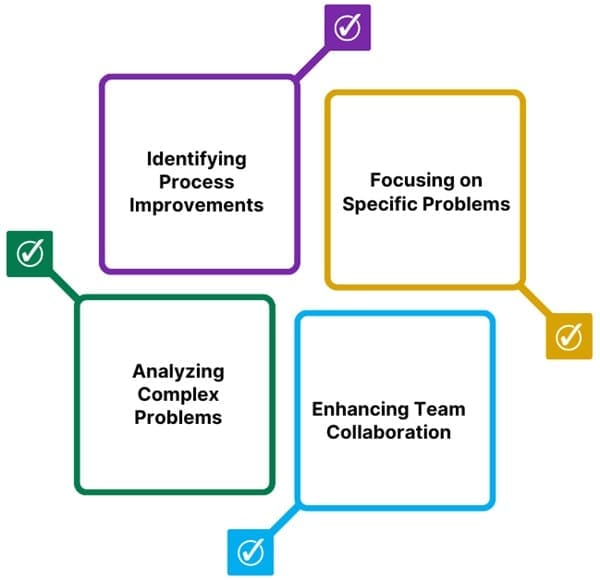
The Fishbone Diagram is particularly useful in the following situations:
- Focusing on Specific Problems: When a team needs to address a specific issue, the diagram helps in narrowing down the root causes rather than merely addressing symptoms.
- Enhancing Team Collaboration: The diagram serves as a brainstorming tool, encouraging team members to contribute their insights and ideas.
- Analyzing Complex Problems: When a problem has multiple contributing factors, the Fishbone Diagram provides a structured approach to organizing these factors.
- Identifying Process Improvements: It helps identify areas where you can make improvements to prevent future occurrences of the problem.
Steps to Create a Fishbone Diagram
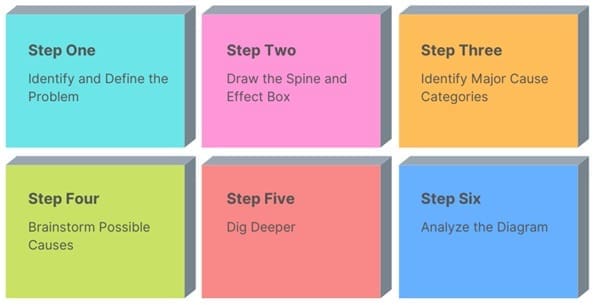
- Identify and Define the Problem: Clearly state the problem at the “head” of the fish. The problem should be defined as specifically as possible, avoiding vague terms.
- Draw the Spine and Effect Box: Draw a horizontal line (the spine) from the problem statement, and create branches (the bones) extending from this spine.
- Identify Major Cause Categories: Determine the main categories of causes that could contribute to the problem. These categories become the primary branches off the spine.
- Brainstorm Possible Causes: Within each category, brainstorm all potential causes. Ask “Why does this happen?” for each factor and list these as smaller branches.
- Dig Deeper: Continue to ask “Why?” to uncover deeper levels of causes. This helps in identifying the root causes that need to be addressed.
- Analyze the Diagram: Once the diagram is complete, analyze it to identify the most likely root causes that contribute to the problem.
Tips for Using the Fishbone Diagram
- Focus on Causes, Not Symptoms: It’s easy to get sidetracked by symptoms, but the purpose of the Fishbone Diagram is to drill down to the underlying causes.
- Use Visuals: Drawing the diagram on a large surface like a flip chart or dry-erase board helps in keeping the process interactive and engaging.
- Encourage Participation: Make sure every team member contributes to the brainstorming process. This ensures a diverse range of ideas and perspectives.
- Use the “Five Whys” Technique: The “Five Whys” is a method of repeatedly asking “Why?” to peel back layers of causes and get closer to the root cause. This technique is often used alongside the Fishbone Diagram.
Benefits of the Fishbone Diagram
The Fishbone Diagram offers several advantages:
- Structured Approach: It provides a systematic method for analyzing causes, which can be more effective than unstructured brainstorming.
- Visual Clarity: By laying out causes visually, it becomes easier to see relationships and patterns that might not be evident in a list or narrative form.
- Comprehensive Analysis: It encourages thorough exploration of all possible causes, reducing the likelihood of overlooking important factors.
- Facilitates Team Collaboration: The diagram promotes teamwork and collective problem-solving, as it involves input from various stakeholders.
Potential Pitfalls
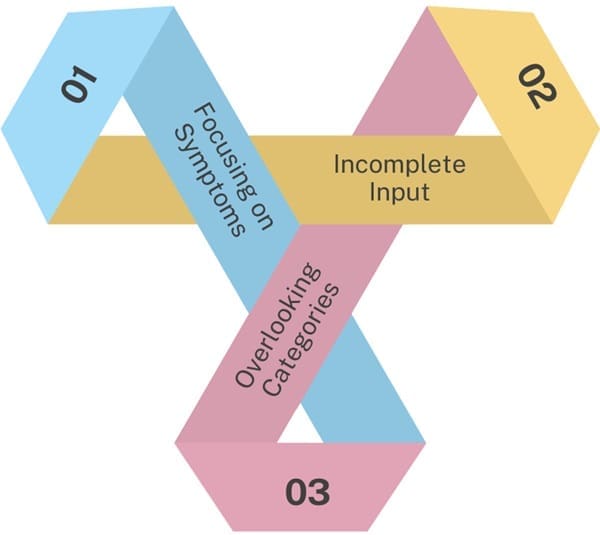
While the Fishbone Diagram is a useful tool, there are some common pitfalls to avoid:
- Focusing on Symptoms: There’s a risk of listing symptoms rather than true causes, which can lead to ineffective solutions.
- Overlooking Key Players: If key stakeholders are not involved in the process, important insights might be missed, leading to incomplete analysis.
- Assumptions Over Facts: Teams might assume they know the causes without thoroughly investigating, which can skew the analysis.
Example
To better understand how the Fishbone Diagram works, consider an example in a healthcare setting. Suppose there is a problem with a patient falls in a hospital. The issue is identified and placed at the head of the fishbone. The major categories might include:
- People: Staff training, communication, staffing levels.
- Methods: Transfer procedures, patient monitoring.
- Machines: Availability and maintenance of equipment like lifts.
- Materials: Condition of flooring, patient footwear.
- Environment: Lighting, room layout.
The team would then brainstorm potential causes within each category. For instance, under “Machines,” you might list “Lift battery not charged” as a cause. This cause could then branch out into “No backup battery available” and “No process for ensuring charged batteries.”
Example of Root Cause Analysis Using a Fishbone Diagram
Imagine a patient falls while being transferred from a wheelchair to the toilet. The caregiver did not use a lift because the battery was being recharged. The lift was out of service, and no backup battery was available. The caregiver believed the patient could be transferred safely without the lift.
In this scenario, the Fishbone Diagram might reveal multiple root causes:
- Process Failures: There was no process in place to ensure that lifts had charged batteries available at all times.
- Communication Gaps: The caregiver was not informed of the new transfer procedure that required two staff members for the transfer.
Types of Fishbone Diagrams
- Simple Fishbone Diagram: The most basic type, allowing flexible categorization of causes specific to any issue or industry. For example, you might use categories like product-related and service-related issues.
- 4S Fishbone Diagram: Used mainly in the service industry, categorizes causes into Surroundings, Systems, Skills, and Suppliers.
- 8P Fishbone Diagram: Includes eight categories: Procedures, Policies, Place, Products, People, Processes, Price, and Promotion. It’s versatile across different businesses.
- 6M Fishbone Diagram: Common in manufacturing, with categories: Man/Manpower, Method, Machine, Material, Measurement, and Mother Nature.
Fishbone Diagram Procedure
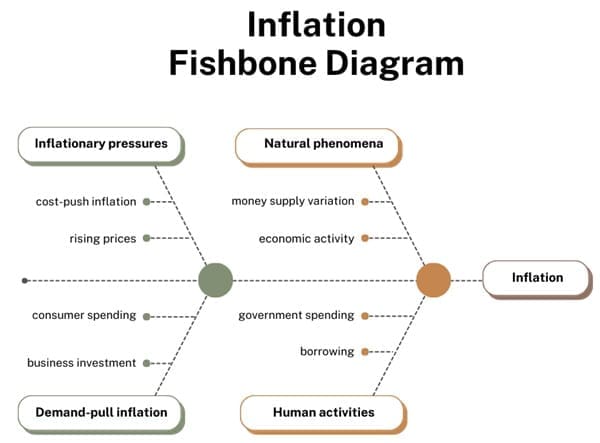
The Fishbone Diagram helps teams brainstorm and organize potential causes of issues. Teams can then analyze these causes to identify the root problem. This structured approach ensures they consider all possible angles when solving a problem.
Here is the process:
- Materials Needed:
- Marking pens
- Flipchart or whiteboard
- Agree on a Problem Statement (Effect):
- Start by clearly defining the problem or effect that you want to analyze.
- Write this problem statement at the centre-right of the flipchart or whiteboard.
- Draw a box around the problem statement to highlight it.
- Draw a horizontal arrow pointing to the problem statement from the left side of the board. This arrow represents the backbone of the Fishbone Diagram, symbolizing the “effect” or problem you’re analyzing.
- Identify Major Categories of Causes:
- Brainstorm the major categories of causes that might be contributing to the problem. These categories serve as the main branches stemming from the central arrow.
- If it’s difficult to determine these categories, you can start with generic headings such as:
- Methods: The processes or procedures in place.
- Machines (Equipment): The tools, technology, or equipment being used.
- People (Manpower): The human factors involved, such as skills, experience, or attitudes.
- Materials: The raw materials, inputs, or resources used.
- Measurement: The data, metrics, or measurements that could impact the outcome.
- Environment: The physical or organizational environment, including external factors.
- Write each category as a branch extending from the main arrow, forming the “fishbone” structure.
- Brainstorm Possible Causes:
- Encourage the team to think broadly and creatively about what could be causing the issue.
- The facilitator writes each idea as a branch from the appropriate category on the diagram.
- It’s important to note that a cause can relate to more than one category. If this is the case, write the cause under all relevant categories.
- Explore Deeper Causes:
- For each identified cause, ask, “Why does this happen?” This question helps to drill down into the root causes.
- Write sub-causes branching off from the main causes to indicate deeper layers of the problem.
- Continue asking “Why?” and adding sub-causes until no further explanations or causes emerge.
- The branches reveal causal relationships and show how different factors connect.
- Review and Refine the Diagram:
- Once the team runs out of ideas, review the diagram as a group.
- Pay special attention to any areas where there are few ideas or branches.
- Refine the diagram by clarifying ambiguous causes and reviewing all potential factors.
Purpose and Importance
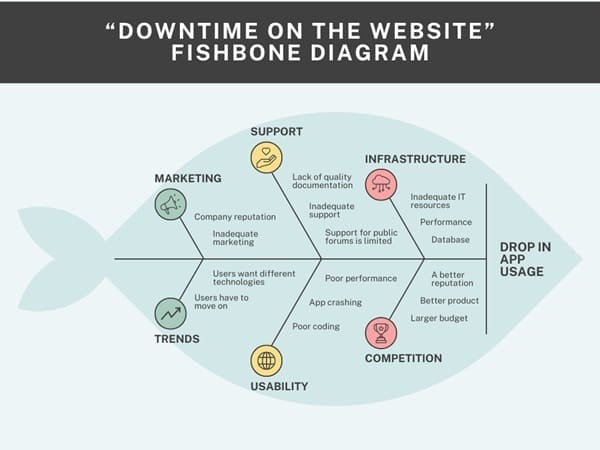
The primary purpose of the Fishbone Diagram is to assist teams in conducting root cause analysis. It helps in identifying underlying factors contributing to a problem, which allows organizations to implement corrective actions that prevent recurrence.
By focusing on root causes rather than symptoms, the Fishbone Diagram provides a structured approach to problem-solving, making it easier to develop sustainable solutions.
Training programs or the replacement of outdated machinery, and taking corrective actions to improve production efficiency.
Final Words
The Fishbone Diagram is an invaluable tool for any team looking to identify and address the root causes of a problem. By providing a clear, visual framework for analyzing cause and effect, it helps teams focus on the most critical issues and develop effective solutions.
Whether used in manufacturing, healthcare, or any other industry, the Fishbone Diagram is a key component of successful problem-solving and continuous improvement efforts.

About Six Sigma Development Solutions, Inc.
Six Sigma Development Solutions, Inc. offers onsite, public, and virtual Lean Six Sigma certification training. We are an Accredited Training Organization by the IASSC (International Association of Six Sigma Certification). We offer Lean Six Sigma Green Belt, Black Belt, and Yellow Belt, as well as LEAN certifications.
Book a Call and Let us know how we can help meet your training needs.


