
You cannot improve what you do not measure. That sentence captures the entire purpose of a performance baseline. Before a Six Sigma team changes anything about a process, it must know exactly how that process performs right now.
A performance baseline measure is that starting point. It documents current process performance using hard data. It sets the reference against which every future improvement will be judged. And it protects a team from the most common mistake in process improvement: claiming success without knowing how bad things were at the start.
Table of contents
Meaning of Performance Baseline Measure
A performance baseline measure is a data-driven snapshot of how a process currently performs, captured before any improvement work begins. It includes the process mean, standard deviation, defect rate, and capability indices (Cp and Cpk). In Six Sigma’s DMAIC framework, building the baseline is the primary goal of the Measure phase.
According to ASQ, the Measure phase establishes baseline performance with trustworthy data collected from a validated measurement system. Without a reliable baseline, a team cannot quantify improvement, justify the project to leadership, or confirm that changes actually worked.
Key Takeaways
- A performance baseline measure captures the current state of a process in quantitative terms before improvement begins.
- The ASQ defines the Measure phase objective as establishing baseline performance with trustworthy data.
- According to the International Six Sigma Institute, 42% of organizations face challenges collecting accurate and reliable data in the Measure phase.
- The baseline must rest on a validated measurement system. Inaccurate gauges produce unreliable baseline data, regardless of sample size.
- Baseline capability is expressed using Cp, Cpk, and sigma level. A Cpk of at least 1.33 meets most customer requirements, per Six Sigma Study Guide.
- The baseline answers the question: how are we doing right now? Every DMAIC phase after Measure depends on this answer.
- Six Sigma Development Solutions trains practitioners to build accurate, defensible baselines in our onsite, live virtual, and online programs.

Public, Onsite, Virtual, and Online Six Sigma Certification Training!
- We are accredited by the IASSC.
- Live Public Training at 52 Sites.
- Live Virtual Training.
- Onsite Training (at your organization).
- Interactive Online (self-paced) training,
What Is a Performance Baseline Measure?
A performance baseline measure is a quantified record of how a process performs at a specific point in time. It captures the output of the process as it currently runs, under normal operating conditions, without any improvement actions in place.
The baseline answers three questions:
What is the process producing?
The baseline captures the mean output and the variability around it. In a manufacturing context, this might be the average dimension of a machined part and the standard deviation of that dimension across a production run.
How often does the process fail?
The baseline records the defect rate: the proportion of outputs that fall outside customer specification limits. This might be expressed as defects per unit (DPU), defects per million opportunities (DPMO), or a simple percentage.
How capable is the process?
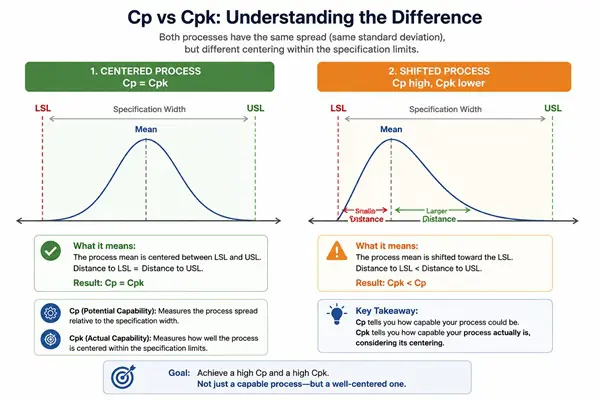
The baseline calculates process capability indices, Cp and Cpk, which show how well the process output fits within the customer’s specification limits.
The Six Sigma Study Guide describes the Measure phase as the stage where the team determines both the baseline and target performance of the process. Without both figures, there is no way to set a meaningful improvement goal or evaluate whether the goal was reached.
Also Read: How Six Sigma Can Measure Your Process Waste Level?
Why the Baseline Comes Before Everything Else
Many improvement teams rush to solutions. They identify a problem, brainstorm fixes, and implement changes within weeks. Then they declare success.
The problem is that they have nothing to compare their results against. They cannot say how much the defect rate dropped. They cannot prove that the process improved at all. They are guessing.
A performance baseline prevents this. It creates an objective reference point. Before a single countermeasure is tested, the team knows exactly what the defect rate was, what Cpk score the process earned, and what sigma level it operated at.
When improvements are implemented, the team measures performance again. The comparison between the baseline and the post-improvement measurement is the evidence of success. Without the baseline, that evidence does not exist.
The ASQ confirms this directly. It states that the Measure phase establishes baseline performance with trustworthy data, and that measurement systems are identified, developed, validated, and improved before that data is collected.
The Five Steps to Building a Performance Baseline

Building a reliable baseline requires following a structured sequence. The International Six Sigma Institute identifies the core Measure phase activities as identifying project outputs, collecting stability data, validating the measurement system, and calculating process capability.
Step 1: Define What You Are Measuring
The team identifies the project Y — the output variable that reflects the problem. It must be measurable, specific, and tied to the customer’s requirements.
Examples of well-defined project Ys:
- Cycle time from order receipt to shipment, measured in hours
- Tablet weight in milligrams for a pharmaceutical product
- First-call resolution rate for a customer service process
- Dimensional tolerance in millimeters for a machined component
Vague project Ys like “customer satisfaction” or “product quality” cannot be baselised. They must be translated into specific, measurable Critical-to-Quality (CTQ) characteristics first.
Step 2: Build a Data Collection Plan
A data collection plan documents how the baseline data will be gathered. It specifies what data will be collected, who will collect it, when, from which part of the process, using which instruments, and in what sample size.
The data collection plan must address sampling strategy. Random sampling gives a representative picture of process output. Convenience sampling, where operators collect data only when it is easy to do so, introduces bias.
According to Master of Project Academy, the data collection process is critical because it ultimately determines the relevance of the data. A well-designed plan prevents the common failure of collecting data that does not accurately reflect the process under normal operating conditions.
Step 3: Validate the Measurement System
This step stops most improvement teams in their tracks, because it reveals a problem they did not expect: the gauges and instruments they have been using for years may not be measuring accurately.
Measurement System Analysis (MSA) — specifically a Gauge Repeatability and Reproducibility (Gauge R&R) study — evaluates two things. Repeatability tests whether the same operator gets the same result on the same part when measuring it multiple times. Reproducibility tests whether different operators get the same result on the same part.
The International Six Sigma Institute states that in the Measure phase, the team reviews R&R to validate the measurement system and improves R&R if variation is high.
The standard acceptance threshold for Gauge R&R is below 10% of tolerance. A measurement system contributing more than 30% of tolerance to the measurement result is unacceptable. If the gauge is unreliable, the baseline data will be unreliable too.
This validation step cannot be skipped. Skipping it means the team is building the entire improvement project on a foundation of inaccurate data.
Step 4: Collect Baseline Data
With the measurement system validated, the team collects production data. The data must represent normal process operation, including the natural variation across shifts, operators, materials, and time periods.
The sample size must be sufficient for statistical analysis. Most capability studies require a minimum of 30 observations. Larger samples (100 or more) produce more stable estimates of the process mean and standard deviation.
The Six Sigma Study Guide specifies that data must be collected in production order. Recording parts out of production order removes the ability to detect trends, cycles, and periodic fluctuations in the process. These patterns are critical to understanding variation.
Step 5: Calculate Process Capability and Sigma Level
With validated data collected in production order, the team calculates the baseline metrics.
Cp (Process Capability Potential) measures whether the process spread fits within the specification width. The formula is:
Cp = (USL minus LSL) divided by 6 times the standard deviation
A Cp above 1.0 means the process spread is narrower than the specification. A Cp below 1.0 means the process is producing output outside specification limits.
Cpk (Process Capability Index) measures both the spread and the centering of the process. It accounts for whether the process mean sits at the center of the specification or skewed to one side.
The Six Sigma Study Guide states that practitioners generally want a Cpk of at least 1.33, which corresponds to 4 sigmas. Most customers require this minimum. More critical processes, such as aerospace or pharmaceutical applications, typically require Cpk above 1.67.

Sigma Level converts the defect rate into a standard scale. A process producing 3.4 defects per million opportunities operates at 6 sigma. A process producing 66,807 defects per million operates at 3 sigma. The International Six Sigma Institute describes the sigma level as the primary way Six Sigma communicates process capability using a common mathematical framework.
What a Complete Performance Baseline Looks Like
A complete performance baseline for a Six Sigma project contains six elements:
- The project Y and its measurement unit — e.g., tablet weight in milligrams
- The specification limits — e.g., USL = 510 mg, LSL = 490 mg
- The sample data summary — process mean and standard deviation from validated data
- The Gauge R&R result — confirming the measurement system is acceptable
- The capability indices — Cp, Cpk, calculated from the data
- The sigma level and DPMO — expressing capability as a defect rate
Together, these six elements answer every question a project sponsor might ask about current process performance. They form the factual foundation for the project’s improvement goal and the benchmark against which success will be measured.
Common Mistakes That Corrupt a Baseline
Even experienced practitioners make errors during baseline measurement. Three mistakes appear most often.
Using an unvalidated measurement system. Skipping Gauge R&R and collecting data with an unreliable gauge produces a baseline that reflects instrument error, not process behavior. The Six Sigma Institute explicitly requires measurement system validation before collecting baseline data.
Collecting data under unusual conditions. If baseline data is collected during a period when the process is not running normally, such as during a startup period, after a recent maintenance event, or with a temporary operator, the baseline will not represent typical process performance. Data must come from a representative period of normal operation.
Treating a stable process mean as a reliable baseline. A process mean tells you where the process is centered. Cpk tells you how reliably it stays there. A process with a mean of 500 mg and a Cpk of 0.8 is producing defects even though its average output looks correct. The full baseline always includes both the mean and the capability index.
Also Read: Common Sources of Measurement Bias in Six Sigma Projects
How the Baseline Drives Every Downstream DMAIC Phase
The performance baseline does not stay in the Measure phase. It feeds every subsequent step.
Analyze: Root cause analysis investigates why the process produces its current Cpk. The gap between the baseline and the target defines how much variation needs to be removed.
Improve: Solutions are designed to close the capability gap. Pilot runs are compared against the baseline to confirm that improvement occurred.
Control: The control plan sets monitoring parameters that detect when the process begins drifting back toward its baseline performance level.
A weak baseline produces weak analysis, poorly targeted improvements, and control limits that are set on unreliable data. A strong baseline makes every downstream phase faster, more precise, and more credible.
Frequently Asked Questions: Performance Baseline Measure
Q: What is a performance baseline measure in Six Sigma?
A: A performance baseline measure is a data-driven snapshot of current process performance, captured before improvement begins. It includes the process mean, standard deviation, defect rate, and capability indices Cp and Cpk. The ASQ describes the Measure phase goal as establishing baseline performance with trustworthy data. The baseline serves as the reference point for measuring the impact of all subsequent improvements.
Q: Why must the measurement system be validated before collecting baseline data?
A: The measurement system must be validated because an unreliable gauge introduces its own variation into the data. If the gauge contributes more than 10% of the tolerance to measurement variation, the data it produces does not accurately reflect the process. The International Six Sigma Institute states that the Measure phase requires reviewing Gauge R&R and improving it if variation is high, before any process capability data is collected.
Q: What is a good Cpk for a baseline?
A: A Cpk of 1.33 or higher meets most customer requirements, according to Six Sigma Study Guide. This corresponds to a process operating at approximately 4 sigma. More critical processes, including aerospace components and pharmaceutical products, typically require a Cpk of 1.67 or higher. A Cpk below 1.0 means the process is actively producing defects relative to specification limits.
Q: How much data is needed for a reliable performance baseline?
A: Most process capability studies require a minimum of 30 data points. Larger samples, typically 100 or more observations, produce more stable estimates of the process mean and standard deviation. The Six Sigma Study Guide specifies that data must be recorded in production order to detect trends, cycles, and periodic fluctuations in the process.
Q: What is the difference between Cp and Cpk in a baseline?
A: Cp measures process spread relative to specification width. It shows whether the process is capable in potential, ignoring where the process mean sits. Cpk measures both spread and centering. It accounts for how far the process mean sits from the nearest specification limit. A process can have a high Cp but a low Cpk if its output is shifted toward one specification boundary. A complete baseline always reports both figures.
Q: What happens if the baseline data is collected under unusual conditions?
A: Baseline data collected during startup, maintenance recovery, or other non-representative periods will not reflect normal process behavior. The baseline will be inaccurate, and all downstream analysis and improvement targets will be based on false information. Data must come from a representative period of typical process operation under standard conditions, materials, operators, and equipment settings.
Building Performance Baselines in Six Sigma Training
Building a reliable performance baseline requires specific skills. Practitioners must know how to design a data collection plan, run a Gauge R&R study, calculate Cp and Cpk correctly, and convert those figures into a sigma level.
These are core Measure phase competencies in Green Belt and Black Belt training.
At Six Sigma Development Solutions, our training programs cover the full Measure phase curriculum. Practitioners learn to build defensible baselines using real process data in exercises that reflect the situations they face on the job.
We offer training in three formats:
- Onsite training — delivered at your facility, using your actual process data and measurement systems.
- Live virtual training — instructor-led sessions online with real-time interaction and Minitab exercises.
- Online training — self-paced Green Belt and Black Belt programs covering all IASSC-testable Measure phase content.
Explore our Six Sigma training programs or contact our team to find the right program for your team.
About Six Sigma Development Solutions, Inc.
Six Sigma Development Solutions, Inc. offers onsite, public, and virtual Lean Six Sigma certification training. We are an Accredited Training Organization by the IASSC (International Association of Six Sigma Certification). We offer Lean Six Sigma Green Belt, Black Belt, and Yellow Belt, as well as LEAN certifications.
Book a Call and Let us know how we can help meet your training needs.


