
Process drift is a slow, steady change in a process’s average or output over time, without anyone planning it. It matters because drift often goes unnoticed at first, each small step looks harmless, but by the time the process has drifted far enough to cause defects, it has usually been sliding for weeks. In practice, drift shows up on a control chart as a trend: several points in a row moving steadily up or down.
Common causes include tool wear, material breakdown, or a sensor slowly losing calibration. The fix starts with catching the trend early, tracing it to its root cause, and correcting it before the process drifts outside its control limits.
Note: “drift” also has a different meaning in machine learning (“concept drift”), covered briefly near the end of this article.
Quick Reference Table
| Term | What It Means | Looks Like on a Chart | Common Cause |
| Process Drift | A slow, gradual change in a process over time | A trend: several points steadily rising or falling | Tool wear, aging equipment, sensor calibration loss |
| Shift | A sudden, lasting change in the process average | A jump to a new level that then stays there | New material batch, an equipment swap, a new operator |
| Common Cause Variation | Normal, expected day-to-day noise in a stable process | Random scatter within the control limits | The process’s natural, built-in variation |
| Special Cause Variation | An unusual, identifiable event outside normal noise | A point outside the control limits, or a clear pattern | A specific, findable event or condition |
| Control Chart | A chart plotting process data over time with control limits | Shows drift, shift, and random noise all at once | The main SPC tool for spotting all of the above |
Table of contents
Key Takeaways
- Drift is slow; a shift is sudden. Both change a process’s average over time, but drift creeps, while a shift jumps to a new level almost right away.
- On a control chart, drift shows up as a trend, usually defined as six or seven points in a row steadily moving in one direction.
- Common causes of drift include tool wear, material aging, temperature changes, and sensor or calibration decay. These are all things that happen gradually, which is exactly why drift is gradual too.
- Drift is a form of special cause variation, meaning it has a real, findable cause. It should be investigated, not treated as normal day-to-day noise.
- Catching drift early gives you a repair window. A trend often shows up days or weeks before a process would actually fail completely, giving teams time to fix it on a planned schedule instead of an emergency one.
- “Drift” has a second, unrelated meaning in machine learning, called concept drift, where a prediction model’s accuracy declines as real-world patterns change. This article focuses on process drift; the two are different ideas that happen to share a name.
- A control chart is the standard tool for catching drift, especially during the Control phase of DMAIC, where the goal is to protect an improvement from sliding back to the old way of doing things.
What Is Process Drift?
Process drift is a slow, steady change in a process’s output or average over time, happening gradually rather than all at once. It’s the reason a process that was performing well six months ago might now be quietly sliding toward producing defects, without anyone deciding to change anything on purpose.
Drift is different from randomness. A stable process always has some natural, expected noise, small ups and downs that don’t mean anything is actually changing. Drift is different: it’s a real, ongoing change with a real, findable cause, even though each individual step in that change looks small.

Public, Onsite, Virtual, and Online Six Sigma Certification Training!
- We are accredited by the IASSC.
- Live Public Training at 52 Sites.
- Live Virtual Training.
- Onsite Training (at your organization).
- Interactive Online (self-paced) training,
Why Does Process Drift Matter?
Drift matters because it’s easy to miss while it’s happening. Each single measurement, taken on its own, might look fine. It’s only when you look at several measurements in a row that the pattern becomes clear.
This is exactly the danger the Control phase of DMAIC exists to guard against. After a team improves a process, the natural tendency, without active monitoring, is for that process to slowly slide back toward its old, worse performance. Placing a control chart on the key output after an improvement lets a team catch that slide immediately, rather than discovering months later that all the gains have quietly disappeared.
Catching drift early also has a practical, scheduling benefit. A trend often shows up in the data well before a process would actually fail or start producing bad output, sometimes days or weeks in advance. That gap is a real opportunity: it means a team can schedule a fix during planned downtime instead of scrambling to react after the damage is already done.
Also Read: Process Governance: Framework, Roles, and Six Sigma Connection
How Do You Spot Drift on a Control Chart?
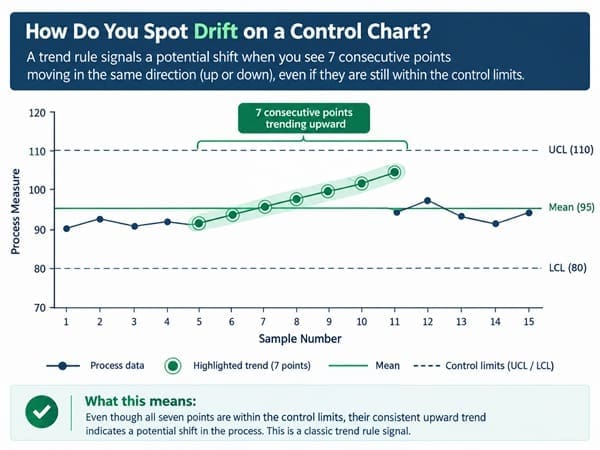
A control chart plots your process data over time, with a center line and upper and lower control limits marking the normal range of expected variation. Drift shows up as a specific, recognizable pattern within that chart: a trend.
The standard trend rule used in SPC: six or seven consecutive points steadily increasing, or steadily decreasing, even if every single one of those points is still technically inside the control limits. That last part is important. A trend can be a real warning sign long before any individual point actually breaks a control limit, which is exactly why it’s worth watching for on its own, separate from just checking whether points fall outside the limits.
What Causes Process Drift?
Drift usually comes from something that itself changes gradually. The most common causes include:
- Tool wear, where a cutting tool, drill bit, or mold slowly degrades with use.
- Material aging or decay, where a raw material’s properties shift the longer it sits in storage or in process.
- Temperature changes, especially in processes sensitive to ambient conditions across a shift or a season.
- Calibration decay, where a sensor or measurement instrument slowly loses accuracy over time.
- Operator fatigue, where a process performed by hand gradually changes as a worker tires over a long shift.
Process Drift vs. Shift: What’s the Real Difference?
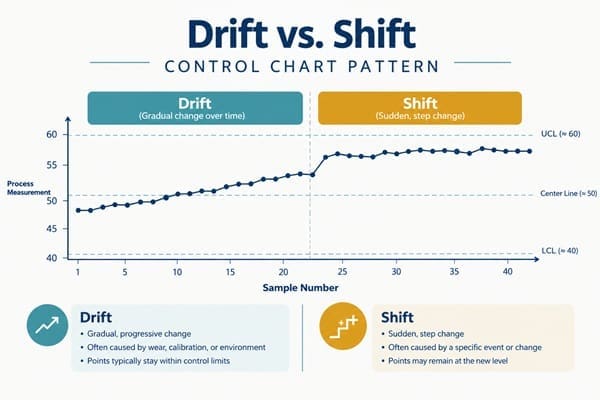
This is the distinction most competing pages blur together, and it directly connects to SSDSI’s existing glossary entry on control chart shifts.
| Factor | Drift | Shift |
| Speed of change | Slow and gradual | Sudden, often within one or two points |
| Pattern on a chart | A steady trend line | A jump to a new level that then holds steady |
| Typical cause | Tool wear, material aging, calibration decay | A new material batch, equipment swap, new operator |
| Warning time | Often gives days or weeks of advance notice | Usually little to no advance notice |
How do you tell them apart in practice?
A shift looks like a step: the process average jumps to a new level almost immediately and then holds there, often because something changed all at once (a new supplier’s material, a machine getting swapped out). A drift looks like a ramp: the process average slides slowly in one direction over many points, because whatever’s causing it is itself changing little by little.
How Do You Catch and Fix Process Drift?
1. Set Up a Control Chart on the Key Output
Track the process characteristic that matters most, using a control chart with correctly calculated control limits, so you have a clear baseline for what “normal” looks like.
2. Watch for the Trend Rule, Not Just Out-of-Limits Points
Actively check for six or seven consecutive points moving steadily in one direction, since this pattern can appear well before any single point actually breaks a control limit.
3. Investigate the Likely Cause
Once a trend is confirmed, check the usual suspects first: tool wear, material age, calibration schedules, and temperature or environmental conditions. Drift almost always traces back to something that itself changes gradually.
4. Correct the Cause, Not Just the Symptom
Fix or replace the actual degrading component (recalibrate the sensor, replace the worn tool, adjust for the material change), rather than simply nudging the process setting back to center. Adjusting the setting without fixing the cause usually means the same drift returns shortly after.
Also Read: Layered Process Audit (LPA): Layers, Frequency, and CQI-8
Real-World Example (Hypothetical)
Problem: A plastics manufacturer runs a control chart on the wall thickness of a molded part. For several weeks, the chart shows a steady, small increase in average thickness, each week’s points slightly higher than the last.
Analysis: No single point has broken a control limit yet, but the trend rule fires: seven points in a row moving in the same direction. The team recognizes this as drift, not random noise.
Six Sigma approach: Rather than waiting for a point to break the limit, the team investigates immediately. They check the mold, the material feed, and the machine’s temperature settings, the most likely gradual-change culprits.
Action: They find the mold has slowly worn at a specific cavity, gradually allowing slightly more material to flow in with each cycle. The mold is scheduled for repair during the next planned maintenance window.
Result (hypothetical): The repair is done before any part actually falls outside spec, avoiding both scrap and an unplanned production stop. This is a hypothetical illustration of the drift-detection pattern, not a documented case study.
A Different “Drift”: Concept Drift in Machine Learning
If you’ve come across the word “drift” in a data science or AI context, it likely refers to something different: concept drift. This is a machine learning term describing what happens when a predictive model’s accuracy declines because the real-world patterns it was trained on have changed.
For example, a model predicting weekly retail sales might slowly become less accurate over time if customer shopping behavior changes due to seasonality, new competitors, or shifting habits, even though nothing about the model itself was changed. The model’s predictions “drift” away from reality as the real world moves on without it.
Process drift and concept drift share a name but describe different things. Process drift is a physical or operational change in a manufacturing or business process, tracked with a control chart. Concept drift is a change in the relationship between input data and a predicted outcome, tracked by monitoring a model’s ongoing accuracy. If you’re working on a Six Sigma or quality improvement project, process drift is almost certainly the concept you need.
Common Mistakes When Dealing With Process Drift
- Waiting for a point to break the control limit before investigating. The trend rule is designed to catch drift earlier than that; waiting for an out-of-limits point gives up that early warning.
- Adjusting the process setting without fixing the root cause. Nudging the machine back to center without addressing the worn tool or aging material usually means the drift starts right back up again.
- Treating drift as random noise. Drift has a real, findable cause. Dismissing a clear trend as “normal variation” delays the investigation that would actually catch it.
- Confusing drift with a shift. Applying shift-style thinking (look for what changed all at once) to a slow trend can send an investigation in the wrong direction entirely.
- Ignoring the “concept drift” search intent entirely. If your organization also works with predictive models, be clear internally about which kind of drift a conversation or report is actually about.
Frequently Asked Questions (FAQs) on Process Drift
Q: What is process drift in Six Sigma?
A: Process drift is a slow, gradual change in a process’s average or output over time, usually caused by something that itself degrades gradually, like tool wear, material aging, or sensor calibration loss. It’s detected on a control chart as a steady trend.
Q: What is the difference between drift and shift on a control chart?
A: Drift is a slow, gradual trend, several points steadily moving in one direction. A shift is a sudden, lasting jump to a new level, usually caused by something that changed all at once, like a new material batch or equipment swap.
Q: What causes process drift?
A: Common causes include tool wear, material aging or decay, temperature changes, sensor or calibration decay, and operator fatigue during long manual work. These are all things that change gradually, which produces the gradual pattern of drift.
Q: How do you detect drift on a control chart?
A: Watch for the trend rule: typically six or seven consecutive points steadily increasing or decreasing, even if every point is still within the control limits. This pattern often appears before any single point actually breaks a limit.
Q: Is “drift” the same in Six Sigma and machine learning?
A: No. In Six Sigma, process drift refers to a gradual change in a physical or operational process, tracked with a control chart. In machine learning, “concept drift” refers to a predictive model’s accuracy declining because real-world patterns have changed. They share a name but describe unrelated concepts.
Q: How do you stop a process from drifting?
A: Catch the trend early using a control chart, investigate the likely gradually-changing cause (tool wear, calibration, material aging), and fix that root cause directly rather than just adjusting the process setting back to center.
Final Words
Process drift is dangerous precisely because it’s quiet. No single measurement looks alarming; it’s the pattern across several measurements that tells the real story. A control chart, watched for the trend rule and not just for points breaking a limit, is what turns that quiet slide into an early warning. Catching drift while it’s still a trend, and fixing the actual degrading cause behind it, is what keeps a hard-won process improvement from sliding back to where it started.
Reading a control chart well enough to catch a trend before it becomes a real problem is a core Control-phase skill every Six Sigma practitioner needs.
Six Sigma Development Solutions, Inc. (SSDSI) is IASSC-accredited and 5-star rated on Google Reviews, having certified 5,322+ professionals across 600+ organizations in 52 cities. Our onsite, live virtual, public, and online Green Belt and Black Belt training covers control charts, SPC rules, and root cause investigation in the depth needed to catch drift before it costs you. Explore SSDSI’s Green Belt certification to build that foundation.
About Six Sigma Development Solutions, Inc.
Six Sigma Development Solutions, Inc. offers onsite, public, and virtual Lean Six Sigma certification training. We are an Accredited Training Organization by the IASSC (International Association of Six Sigma Certification). We offer Lean Six Sigma Green Belt, Black Belt, and Yellow Belt, as well as LEAN certifications.
Book a Call and Let us know how we can help meet your training needs.


