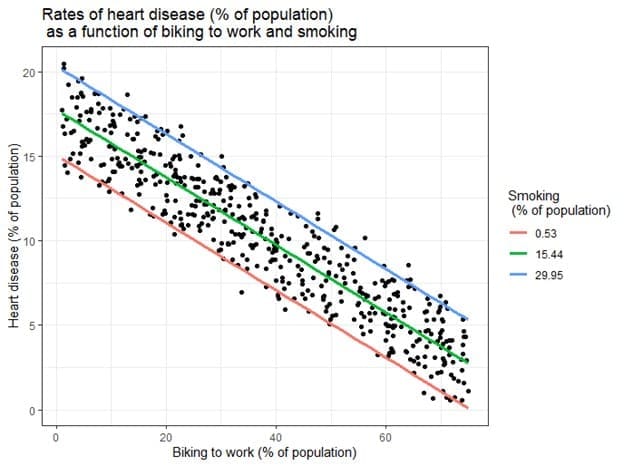
In statistical modeling, multiple linear regression analysis is a set of statistical processes for estimating the relationships between a dependent variable (often called the ‘outcome variable’) and one or more independent variables (often called ‘predictors’, ‘covariates’, or ‘features’). The most usual form of regression analysis is linear regression, in which one finds the line (or a more complex linear combination) that most closely fits the data according to a specific mathematical criterion. For example, the method of ordinary least squares computes the unique line (or hyperplane) that minimizes the sum of squared differences between the true data and that line (or hyperplane). For specific mathematical reasons (see linear regression), this allows the researcher to estimate the conditional expectation (or population average value) of the dependent variable when the independent variables take on a given set of values. Less common forms of regression use slightly different procedures to estimate alternative location parameters (e.g., quantile regression or Necessary Condition Analysis) or estimate the conditional expectation across a broader collection of non-linear models (e.g., nonparametric regression).

Multiple linear regression analysis is primarily used for two conceptually distinct purposes. First, regression analysis is widely used for prediction and forecasting, where its use has substantial overlap with the field of machine learning. Second, in some situation’s regression analysis can be used to infer causal relationships between the independent and dependent variables. Importantly, regressions by themselves only reveal relationships between a dependent variable and a collection of independent variables in a fixed dataset. To use multiple linear regression for prediction or to infer causal relationships, respectively, a researcher must carefully justify why existing relationships have predictive power for a new context or why a relationship between two variables has a causal interpretation. The latter is especially important when researchers hope to estimate causal relationships using observational data.
In practice, researchers first select a model they would like to estimate and then use their chosen method (e.g., ordinary least squares) to estimate the parameters of that model. Regression models involve the following components:
- The unknown parameters, often denoted as a scalar or vector .
- The independent variables, which are observed in data and are often denoted as a vector (where denotes a row of data).
- The dependent variable, which are observed in data and often denoted using the scalar .
- The error terms, which are not directly observed in data and are often denoted using the scalar .
Wikipedia “Regression analysis“.
Related articles:


