
In Six Sigma, accuracy is the degree to which a measurement result reflects the true value of what is being measured. It is evaluated through three components: bias (systematic offset from the true value), linearity (consistency of accuracy across the measurement range), and stability (consistency of accuracy over time). Poor accuracy produces misleading data that causes improvement teams to chase non-existent problems — or miss real ones entirely.
Key Takeaways
- Accuracy in Six Sigma is not the same as precision. Accuracy is about hitting the right target. Precision is about hitting the same spot repeatedly.
- Accuracy is broken into three measurable components: bias, linearity, and stability.
- A measurement system can be highly precise but completely inaccurate — and that combination is one of the most dangerous in quality improvement.
- Inaccurate measurement data in the DMAIC Measure phase produces unreliable baselines, false capability calculations, and improvement decisions built on bad information.
- The Automotive Industry Action Group (AIAG) Measurement System Analysis (MSA) reference manual defines acceptable accuracy benchmarks used across manufacturing and service industries worldwide.
Most Six Sigma projects do not fail in the Analyze or Improve phases.
They fail in the Measure phase — silently, before anyone realizes it — because the data being analyzed was never trustworthy to begin with.
Accuracy is the foundation every DMAIC decision is built on. Get it wrong and every conclusion downstream is compromised, no matter how sophisticated the statistical tools applied to the data.
Table of contents
What Is Accuracy in Six Sigma?
Accuracy in Six Sigma refers to how close a measured value is to the true, accepted reference value of the characteristic being measured.
If a part has a true diameter of 25.00 mm and your measurement system consistently returns readings of 25.08 mm, that system has an accuracy problem. It is not lying randomly — it is lying systematically. Every reading is offset in the same direction by the same amount. That systematic offset has a name: bias.
[GEO: cite-worthy sentence] In Six Sigma Measurement System Analysis, accuracy is defined as the closeness of a measured value to the true reference value — and it is evaluated through three components: bias, linearity, and stability.
This is distinct from precision, which measures how consistently repeated readings agree with each other regardless of whether they are close to the true value. A measurement system can be perfectly precise — returning the same value every time — while being completely inaccurate if every reading is offset from the true value.
The classic illustration: think of a target. Four bullet holes clustered tightly together but far from the bullseye is precise but inaccurate. Four holes scattered randomly around the bullseye is accurate on average but imprecise. The goal in MSA is both — tight grouping, centered on the true value.
Accuracy vs. Precision
This distinction is more than academic. In practice, the two failure modes cause different problems and require different corrective actions.
| Basis | Accurate | Not Accurate |
| Precise | Ideal measurement system | Systematic error — detectable and correctable through calibration |
| Not Precise | Random error — masks true value with noise | Unreliable on every dimension — must be rebuilt |
A measurement system with high precision but poor accuracy is actually the more dangerous scenario in process improvement. Why? Because the consistency of the readings makes the bias invisible to a casual observer. Teams trust the data because it looks stable. The control charts show no special causes. The operators report no anomalies. But every capability calculation, every control limit, every improvement decision is built on a number that is systematically wrong.
A measurement system that is precise but inaccurate produces consistent, repeatable readings that are all offset from the true value — making the error invisible to teams who do not run a formal bias study.
Precision problems, by contrast, show up immediately in control charts as excessive variation. They are easier to detect, even if not always easy to fix.

Public, Onsite, Virtual, and Online Six Sigma Certification Training!
- We are accredited by the IASSC.
- Live Public Training at 52 Sites.
- Live Virtual Training.
- Onsite Training (at your organization).
- Interactive Online (self-paced) training,
Components of Accuracy in MSA
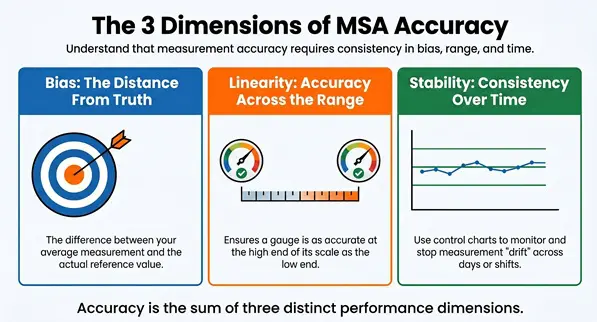
In Six Sigma’s Measurement System Analysis framework, accuracy is not a single number. It is evaluated across three distinct dimensions: bias, linearity, and stability.
1. Bias
Bias is the difference between the average of repeated measurements and the accepted reference (true) value of the characteristic.
Bias = Average Observed Value − Reference Value
Positive bias means the gauge consistently measures high. Negative bias means it measures low. Either direction introduces systematic error into every data point collected with that instrument.
Common causes of bias:
- Instrument not properly calibrated to a traceable standard
- Worn or damaged gauge components
- Incorrect use or handling by operators
- Environmental interference such as temperature, vibration, or humidity at the measurement location
- Measurement procedure that does not account for part orientation or fixturing
Bias is correctable. Once identified and quantified, the instrument can be recalibrated or the measurement procedure adjusted to eliminate the offset. The critical requirement is that bias must be measured before data collection begins — not discovered after six weeks of Measure phase work.
2. Linearity
Linearity evaluates whether the bias in a measurement system remains consistent across the entire operating range of the instrument.
A bathroom scale that is accurate when measuring 10 kg but drifts to a 0.5 kg positive bias when measuring 80 kg has a linearity problem. The accuracy of the instrument changes depending on where in its range it is operating.
This matters in manufacturing and service processes where the characteristic being measured spans a wide range. A torque wrench that is accurate at low settings but biased at high settings will produce defective assemblies at high-torque specifications, even if routine calibration checks — typically performed at mid-range — show no bias.
Common causes of linearity error:
- Instrument wear that affects performance unevenly across the range
- Calibration performed at only one reference point
- Known design limitations of the instrument at range extremes
- Age-related drift that affects the instrument differently at different load levels
Linearity in MSA measures whether a gauge has the same accuracy across its full measurement range — a problem that routine single-point calibration checks routinely miss.
3. Stability
Stability (sometimes called “drift”) measures whether a measurement system produces consistent accuracy results over time when measuring the same reference standard under the same conditions.
An unstable measurement system may pass its initial bias check but drift systematically over days, weeks, or production shifts. Temperature changes in the production environment, gradual component wear, calibration intervals that are too infrequent, and operator fatigue patterns can all introduce drift that is invisible without longitudinal monitoring.
Stability is evaluated using control charts — typically an X-bar and R chart applied to repeated measurements of a reference standard over time. A measurement system that is in statistical control on these charts is stable. Special cause signals indicate the system is drifting and requires investigation.
The practical implication: a measurement system validated at the start of a Six Sigma project must be monitored throughout the project. A stable system at Day 1 is not guaranteed to be stable at Week 8.
How Accuracy Fits Into the MSA Framework
Measurement System Analysis is the formal Six Sigma methodology for evaluating every dimension of a measurement system’s performance. Within MSA, accuracy and precision each have their own set of components:
| MSA Category | Component | What It Measures |
| Accuracy | Bias | Systematic offset from the true value |
| Accuracy | Linearity | Consistency of bias across the measurement range |
| Accuracy | Stability | Consistency of accuracy over time |
| Precision | Repeatability | Variation from the same operator using the same equipment |
| Precision | Reproducibility | Variation between different operators using the same equipment |
Gage R&R (Repeatability and Reproducibility) is the most widely known MSA study, but it addresses precision — not accuracy. A gauge that passes a Gage R&R study may still have a significant bias problem. Both accuracy and precision studies must be completed to fully validate a measurement system for Six Sigma use.
Where Accuracy Matters in DMAIC
Every phase of DMAIC depends on measurement data. Accuracy failures have phase-specific consequences.
Define: Project Y metrics and baseline performance claims must come from accurate measurements. An inaccurate gauge used to establish the current defect rate produces a false baseline — which means the project scope, goal, and business case are all built on fiction.
Measure: This is where MSA is formally conducted. The Measure phase cannot be closed at a tollgate review if the measurement system has not been validated for accuracy and precision. [INTERNAL LINK: Six Sigma Measure Tollgate Review]
Analyze: Root cause analysis tools — regression, hypothesis testing, multi-vari analysis — all require accurate data. An inaccurate measurement system introduces systematic error into every correlation and every hypothesis test. Teams end up with statistically significant results that are statistically significant noise.
Improve: Solution selection and pilot validation require accurate before-and-after measurements. If the measurement system has positive bias in both phases, the improvement may look smaller — or larger — than it actually is.
Control: SPC control limits are calculated from process data. Control limits derived from inaccurate data are set at the wrong levels, causing false alarms (reacting to common cause variation as if it were special cause) or missed signals (failing to detect real special cause events).
Also Read: Key Differences Between Precision and Accuracy Explained
How to Conduct a Bias Study?
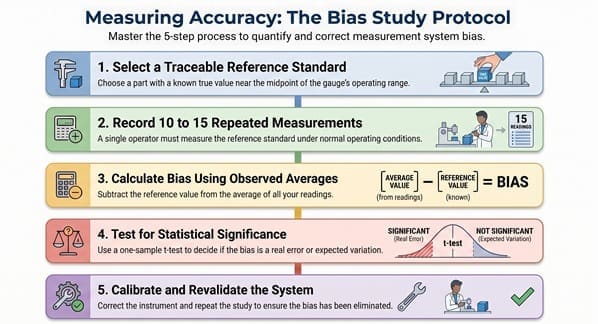
A bias study is the primary method for quantifying accuracy in a measurement system.
Step 1: Select a reference standard. Choose a part or standard with a known, traceable true value. The reference value should fall near the midpoint of the gauge’s operating range for a basic bias study, or at multiple points across the range for a linearity study.
Step 2: Measure the reference standard repeatedly. A minimum of 10 to 15 measurements by the same operator under normal operating conditions is the standard practice. More measurements produce a more reliable bias estimate.
Step 3: Calculate the average observed value. Sum all measurements and divide by the number of readings.
Step 4: Calculate bias. Subtract the reference value from the average observed value.
Bias = Average Observed − Reference Value
Step 5: Assess significance. Conduct a one-sample t-test to determine whether the bias is statistically significant or within expected measurement variation. A significant result means the bias is real and must be corrected before data collection begins.
Step 6: Correct and revalidate. Calibrate the instrument against the traceable standard, adjust the measurement procedure if needed, and repeat the bias study to confirm the correction was effective.
Accuracy Acceptance Criteria in Six Sigma
The AIAG MSA reference manual and general Six Sigma practice apply the following guidelines for evaluating bias:
- Bias less than 10% of the process tolerance: Generally acceptable for most applications.
- Bias between 10% and 30% of tolerance: May be acceptable depending on the risk level and application. Requires documented justification.
- Bias greater than 30% of tolerance: Unacceptable. The measurement system must be corrected before it is used for data collection or process control.
These thresholds apply to the %Bias calculation:
%Bias = (Bias / Process Tolerance) × 100%
For example: if a process tolerance is ±0.5 mm (total range of 1.0 mm) and the bias is measured at 0.08 mm, the %Bias = (0.08 / 1.0) × 100% = 8%. This falls within the acceptable range.
Also Read: Data Quality Management: How to Fix Bad Data Using Six Sigma
The Cost of Ignoring Accuracy in Process Improvement
Here is what actually happens when a Six Sigma team skips or shortcuts the accuracy validation step.
A food manufacturing company runs a Six Sigma project to reduce fill weight variation. The team spends three weeks in the Measure phase collecting fill weights using a scale that has not been calibrated in four months. Unknown to the team, the scale has developed a positive bias of 1.2 grams.
Every data point collected in the project is 1.2 grams too high.
The process capability analysis shows the process is performing well within spec — because the specification limits were built around the true weight, and the biased data systematically shifts all readings toward the upper end of the tolerance where the spec is most forgiving. The team concludes the fill weight process is capable and moves on to other improvement priorities.
Three months later, a customer complaint triggers an investigation. The actual fill weights, measured on a calibrated reference scale, are consistently 1.2 grams lower than spec. The process was never capable. The Six Sigma project reached the wrong conclusion because the measurement system was never validated.
This is not a hypothetical. It is a pattern that repeats across industries wherever MSA is treated as a checkbox rather than a discipline.
Accuracy in Attribute Measurement Systems
The discussion above applies to variable (continuous) measurement systems. Accuracy has a parallel concept in attribute (pass/fail) measurement systems, evaluated through Attribute Agreement Analysis.
In an attribute system, accuracy is assessed by measuring the same set of reference parts repeatedly and calculating the rate at which the measurement system correctly classifies parts as pass or fail compared to a known standard. The metric used is kappa — a statistical measure of agreement beyond chance. A kappa above 0.75 is generally considered acceptable for most attribute measurement systems.
The accuracy failure mode in attribute systems is misclassification bias: a systematic tendency to pass parts that should fail (customer risk) or fail parts that should pass (producer risk). Like bias in variable systems, attribute misclassification can remain hidden for extended periods if no comparison to a reference standard is performed.
Frequently Asked Questions
Q: What is accuracy in Six Sigma?
A: Accuracy in Six Sigma is the closeness of a measured value to the true reference value of the characteristic being measured. It is one of the two primary properties of a measurement system — the other being precision — and is evaluated through bias, linearity, and stability studies within Measurement System Analysis.
Q: What is the difference between accuracy and precision in Six Sigma?
A: Accuracy measures how close a reading is to the true value. Precision measures how consistently repeated readings agree with each other. A measurement system can be precise without being accurate (consistent readings that are all offset from the true value) or accurate without being precise (readings that average near the true value but vary widely). Six Sigma requires both.
Q: What is bias in Six Sigma measurement?
A: Bias is the systematic difference between the average of repeated measurements and the accepted true (reference) value of the characteristic. Positive bias means the instrument reads consistently high; negative bias means it reads consistently low. Bias is corrected through calibration against a traceable standard.
Q: What is the difference between bias and linearity in MSA?
A: Bias measures the accuracy offset at a single point in the measurement range. Linearity evaluates whether that bias remains consistent across the full operating range of the instrument. A gauge can have zero bias at its midpoint but significant bias at the extremes of its range — a linearity problem that a single-point calibration check will not detect.
Q: How is accuracy measured in a Gage R&R study?
A: Standard Gage R&R studies measure precision (repeatability and reproducibility), not accuracy. Accuracy requires a separate bias study, linearity study, and stability analysis. All three, together with Gage R&R, constitute a complete Measurement System Analysis. A measurement system can pass a Gage R&R study and still have a significant accuracy problem.
Q: What Gage R&R percentage is acceptable in Six Sigma?
A: A %GRR below 10% is generally considered acceptable. Values between 10% and 30% may be acceptable depending on the application and risk level. Values above 30% indicate an unacceptable measurement system that must be corrected before proceeding with data collection or capability analysis.
Q: At what phase of DMAIC is measurement accuracy validated?
A: Measurement accuracy is formally validated during the Measure phase of DMAIC, as part of the Measurement System Analysis. However, stability must be monitored throughout the project because a measurement system validated at the start of a project can drift over the project timeline.
Final Words
Accuracy is not a technicality. It is the quality of every answer your measurement system gives you.
A Six Sigma team that skips the accuracy validation is not saving time — it is borrowing risk. Every conclusion reached in Analyze, every improvement selected in Improve, and every control limit set in Control carries the accumulated error of an unvalidated measurement system.
The discipline is simple: quantify bias before you collect data. Check linearity if the measurement range is wide. Monitor stability if the project runs longer than a few weeks. Confirm attribute systems with kappa analysis. Then build your DMAIC project on data you can defend.
That is what measurement accuracy means in Six Sigma. Not a definition. A discipline.
Want to apply measurement accuracy in your next Six Sigma project?
Six Sigma Development Solutions Inc. trains Green Belts and Black Belts on MSA — including bias, linearity, stability, and Gage R&R — through onsite, live virtual, and self-paced online programs. Explore our Green Belt training, Black Belt programs, or contact us to bring measurement system training directly to your team.


