


Repetition vs Replication: Key Differences
In the pursuit of reliable and valid scientific knowledge, two fundamental concepts stand out: repetition and replication. While often used interchangeably in casual conversation, they represent distinct approaches to validating experimental findings and ensuring the...
What Is The Taguchi Method in Quality Control?
Genichi Taguchi developed the Taguchi Method as a statistical approach to optimize processes and improve quality. Initially, he created it to enhance manufacturing processes, and it has since been applied to various engineering fields, including biotechnology. The...
What Is a Quality Analyst: Job Description, Salary & More
Table of contentsWhat Is a Quality Analyst: Job Description, Salary & MoreWhat is a Quality Analyst?What is the role of a quality analyst?What Experience is Required to Qualify as a Quality AnalystWhat are the skills required for a quality analyst?Quality Analyst...
SIPOC Model Explained: The Cornerstone of Six Sigma Process Mapping
A SIPOC diagram provides a high-level view of a process. The acronym SIPOC stands for Suppliers, Inputs, Process, Outputs, and Customers. This diagram helps visualize and understand the entire process from start to finish. It outlines key elements in the process that...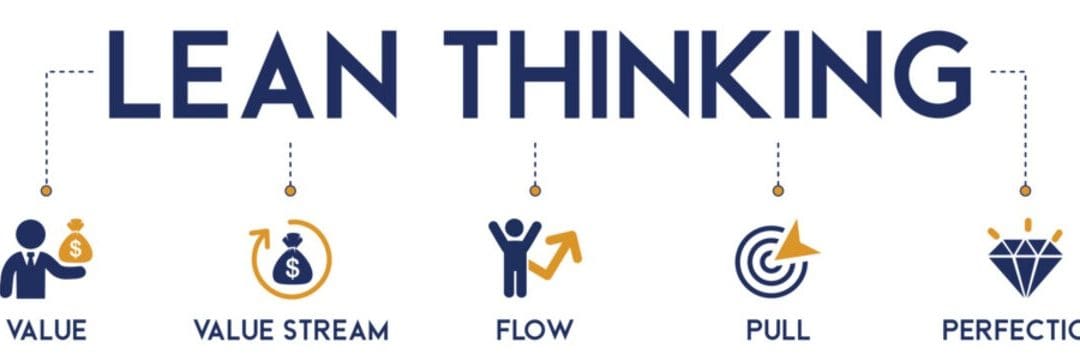
What is Lean Thinking: Principles, Benefits & More
Table of contentsWhat is Lean Thinking: Principles, Benefits & MoreWhat is Lean Thinking?The Beginning of LeanTwo Pillars of LeanWhat is the goal of lean thinking?The 5 Lean Thinking PrinciplesLean Thinking has evolved and its history is fascinatingRelated...

ONLINE COURSES:
-
 FAST-TRACK to a Six Sigma Black Belt Certification
$1,996.00
FAST-TRACK to a Six Sigma Black Belt Certification
$1,996.00
-
Online Lean Six Sigma Green Belt Training & Certification
$998.00
-
Online Lean Six Sigma Black Belt Training & Certification
$998.00
-
Online Lean Six Sigma Yellow Belt Training & Certification
$498.00
-
IASSC (International Association for Six Sigma Certification) Practice Exam (100 Questions)
$99.99
-
Lean Six Sigma Green Belt Project Management Kit
Original price was: $298.99.$98.99Current price is: $98.99.
-
Lean Six Sigma Black Belt Project Management Kit
Original price was: $298.99.$98.99Current price is: $98.99.
-
Lean Six Sigma Yellow Belt Project Management Kit
Original price was: $199.98.$58.99Current price is: $58.99.
-
Lean Six Sigma Root Cause Analysis Online Training (Complete with Certification)
$29.99
-
Lean Six Sigma Project Charter Online Training (Complete with Certification)
$29.99
-
Lean Six Sigma SIPOC Diagram Online Training (Complete with Certification)
$29.99
-
Lean Six Sigma Value Stream Map Online Training (Complete with Certification)
$29.99
-
Lean Six Sigma Input Map Online Training (Complete with Certification)
$29.99
-
Cause and Effect Matrix Online Training (Complete with Certification)
$29.99
-
Failure Modes and Effects Analysis Online Training (Complete with Certification)
$29.99
-
FREE Six Sigma White Belt Certification (Online)
Original price was: $99.99.$0.00Current price is: $0.00.


