

Process mapping is an essential tool for business managers, especially in manufacturing, to visualize workflows, identify inefficiencies, and consequently enhance productivity. By clearly outlining each step in a process, companies can effectively optimize operations, improve quality control, and ultimately reduce costs.
Moreover, process maps offer a visual depiction of workflows, thereby enabling managers to understand, analyze, and improve operational processes. In this article, you will find an in-depth overview of the 7 types of process maps crucial for manufacturing environments.
Specifically, you will learn how each type functions, when to apply it, and see real-world examples tailored for manufacturing settings.
Table of contents
What is a Process Map?
A process map is a visual tool that outlines the sequence of activities within a business or manufacturing process. It highlights the flow of tasks, materials, and decisions, providing a clear snapshot of how a process operates from start to finish.
By using process maps, business managers can:
- Identify inefficiencies such as delays or redundancies
- Clarify roles and responsibilities across teams
- Standardize procedures to improve quality and consistency
- Enhance communication and collaboration between departments
- Support continuous improvement efforts

Public, Onsite, Virtual, and Online Six Sigma Certification Training!
- We are accredited by the IASSC.
- Live Public Training at 52 Sites.
- Live Virtual Training.
- Onsite Training (at your organization).
- Interactive Online (self-paced) training,
Why is Process Mapping Critical in Manufacturing?
Manufacturing processes often involve numerous interconnected steps—such as material procurement, machining, assembly, inspection, packaging, and logistics. Therefore, without a clear understanding of these workflows, inefficiencies and errors can quickly escalate, which in turn impacts lead times, product quality, and costs.
Process mapping allows manufacturing managers to:
- Visualize the entire production lifecycle and pinpoint waste
- Optimize resource allocation and reduce downtime
- Improve compliance with safety and quality standards
- Facilitate training by providing a clear procedural blueprint
- Drive lean manufacturing initiatives to reduce costs and improve delivery
By choosing the appropriate type of process map, manufacturing leaders can tailor their approach to specific challenges within their operations.
The 7 Types of Process Maps
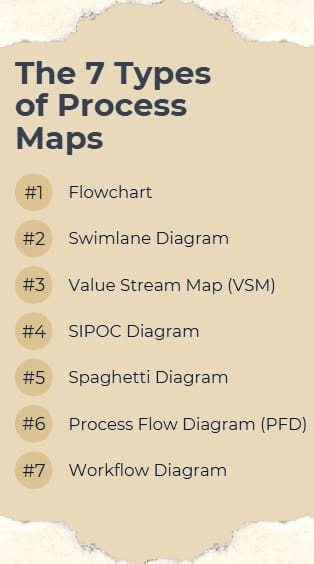
1. Flowchart
Definition:
A flowchart represents a process using standardized symbols—rectangles for activities, diamonds for decision points, arrows for flow direction, and ovals for start/end points.
Purpose:
To illustrate the step-by-step progression of a process, making it easy to follow and analyze.
Manufacturing Example:
Consider an assembly line for producing electronic circuit boards. A flowchart can map the sequence from component receiving, soldering, quality inspection, to packaging. Each step, including quality checks and rework decisions, is clearly represented.
Benefits:
- Simple to create and understand
- Highlights decision points and parallel activities
- Ideal for process documentation and training
2. Swimlane Diagram
Definition:
Swimlane diagrams organize activities into “lanes” representing different departments, roles, or systems, showing who is responsible for each task.
Purpose:
To clarify accountability and interactions between teams.
Manufacturing Example:
In a defect management process, the swimlane diagram might show how operators identify faults, maintenance staff execute repairs, and then quality control approves the fixes. Specifically, each lane represents a function, clearly showing task handoffs and communication.
Benefits:
- Improves cross-functional collaboration
- Reduces delays caused by unclear responsibilities
- Useful for complex processes involving multiple stakeholders
3. Value Stream Map (VSM)
Definition:
Value Stream Mapping is a lean tool that visualizes the flow of materials and information through a production system, distinguishing value-added from non-value-added steps.
Purpose:
To identify waste such as excess inventory, wait times, and unnecessary movements.
Manufacturing Example:
A VSM for automotive parts manufacturing might map the entire supply chain, from raw steel delivery to final assembly, highlighting areas with inventory buildup, transport delays, or redundant inspections.
Benefits:
- Provides a holistic view of production and supply chain
- Drives continuous improvement by focusing on value creation
- Supports lean initiatives to cut costs and speed up delivery
4. SIPOC Diagram
Definition:
SIPOC stands for Suppliers, Inputs, Process, Outputs, and Customers—a high-level process map outlining core components and boundaries.
Purpose:
To define the scope of a process and align stakeholders on key elements.
Manufacturing Example:
In a machining process, a SIPOC diagram lists suppliers of raw materials (steel sheets), inputs (CNC programs), the process steps (cutting, shaping, finishing), outputs (machined components), and customers (assembly line or external clients).
Benefits:
- Sets clear process boundaries
- Helps in process improvement planning and communication
- Serves as a starting point for more detailed mapping
5. Spaghetti Diagram
Definition:
A spaghetti diagram traces the actual movement of workers, materials, or information within a physical workspace, often resembling tangled spaghetti lines.
Purpose:
To detect and reduce unnecessary movement and improve layout efficiency.
Manufacturing Example:
On a factory floor assembling consumer appliances, a spaghetti diagram may reveal excessive walking by workers between workstations, suggesting a reorganization of the layout to save time.
Benefits:
- Helps reduce waste in motion and transportation
- Improves ergonomic conditions and worker productivity
- Supports lean manufacturing layout redesigns
6. Process Flow Diagram (PFD)
Definition:
A Process Flow Diagram shows the flow of materials and equipment within complex processes, especially those involving chemical or physical transformations.
Purpose:
To depict major equipment, process streams, and controls.
Manufacturing Example:
In a chemical plant producing industrial solvents, a PFD illustrates the reactors, heat exchangers, distillation columns, and storage tanks, with arrows indicating flow rates and conditions.
Benefits:
- Provides a detailed technical overview for engineers and operators
- Supports troubleshooting and process optimization
- Essential for compliance and safety documentation
7. Workflow Diagram
Definition:
Workflow diagrams focus on task sequences, decision points, and handoffs related to administrative or procedural workflows.
Purpose:
To streamline internal processes that support manufacturing operations.
Manufacturing Example:
Mapping the purchase order approval process shows the steps from requisition submission, managerial approval, procurement, to receiving and payment, highlighting bottlenecks.
Benefits:
- Improves administrative efficiency
- Reduces processing times and errors
- Enhances transparency in support functions
How to Use Process Maps?
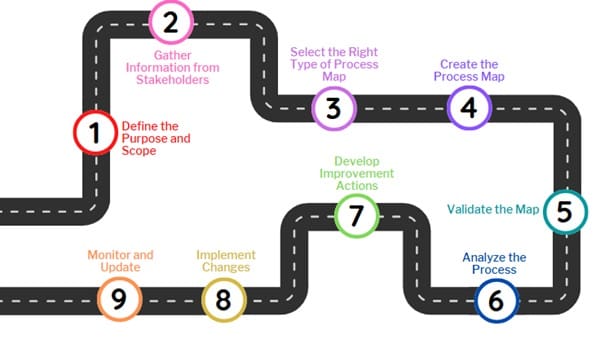
Here’s how manufacturing managers can use process maps to enhance operations:
1. Define the Purpose and Scope
Before creating any process map, clarify why you are mapping the process and which process you want to map. For example:
- Are you trying to reduce lead time?
- Identify quality issues?
- Improve cross-department communication?
2. Gather Information from Stakeholders
Involve the people who work in or manage the process:
- Operators
- Supervisors
- Engineers
- Quality control staff
Conduct interviews, observe the workflow on the shop floor, and review any existing documentation. This ensures the map reflects reality, not assumptions.
3. Select the Right Type of Process Map
Choose from the 7 types of process maps (flowchart, swimlane, VSM, SIPOC, spaghetti diagram, process flow diagram, workflow diagram) based on your goals and complexity.
- Use a Flowchart for simple process overviews.
- Choose VSM to identify waste.
- Opt for a Swimlane Diagram if multiple departments are involved.
4. Create the Process Map
Start mapping the process using clear symbols and notations:
- Use standardized shapes (rectangles, diamonds, arrows).
- Show all steps, decision points, inputs, and outputs.
- For physical movement, use a spaghetti diagram.
Digital tools such as Microsoft Visio, Lucidchart, or specialized manufacturing process mapping software can make this step easier and more collaborative.
5. Validate the Map
Review the process map with all stakeholders:
- Walk through the steps on the shop floor if possible.
- Confirm the accuracy of steps, responsibilities, and flows.
- Adjust the map based on feedback.
6. Analyze the Process
Use the map to identify:
- Bottlenecks and delays
- Redundant or unnecessary steps
- Gaps in responsibilities or communication
- Waste such as excess motion, inventory, or rework
7. Develop Improvement Actions
Based on the analysis, brainstorm and prioritize changes:
- Simplify workflows
- Reassign responsibilities
- Reorganize the workspace (using spaghetti diagram insights)
- Automate or digitize tasks in administrative workflows
8. Implement Changes
Coordinate with teams to:
- Train employees on new procedures
- Adjust equipment or layout if necessary
- Monitor initial results closely
9. Monitor and Update
Process mapping is not a one-time task. Continuous improvement requires:
- Regularly reviewing the map
- Updating it when processes change
- Measuring performance metrics linked to process steps
How to Select the Appropriate Process Map for Manufacturing?
Understanding the nature of your manufacturing challenge is key to selecting the right process map:
| Situation | Recommended Map | Reason |
| Simple, linear process | Flowchart | Easy to understand and communicate |
| Cross-department coordination | Swimlane Diagram | Clarifies roles and responsibilities |
| Identifying waste and delays | Value Stream Map | Focuses on value-adding steps |
| Defining process scope | SIPOC Diagram | High-level overview for alignment |
| Reducing movement on the shop floor | Spaghetti Diagram | Visualizes physical flows |
| Complex equipment/process overview | Process Flow Diagram | Detailed technical depiction |
| Improving administrative workflows | Workflow Diagram | Streamlines support functions |
Manufacturing managers often benefit from combining these maps to gain a layered understanding. For instance, they might use a SIPOC diagram to define scope, a Value Stream Map to target waste, and a Spaghetti Diagram to improve plant layout.
Real-World Application
A mid-sized automotive parts manufacturer used process mapping to improve its production line efficiency. Initially, starting with a Value Stream Map, they identified excessive inventory waiting between machining and assembly. Subsequently, a Spaghetti Diagram revealed that workers traveled long distances between stations due to a poor layout.
As a result, by redesigning the floor plan and implementing a Swimlane Diagram to clarify responsibilities in quality control, the company reduced lead times by 25% and improved throughput by 15%.
Overall, this demonstrates how understanding and applying different process maps can drive measurable operational improvements.
Best Practices for Effective Process Mapping in Manufacturing
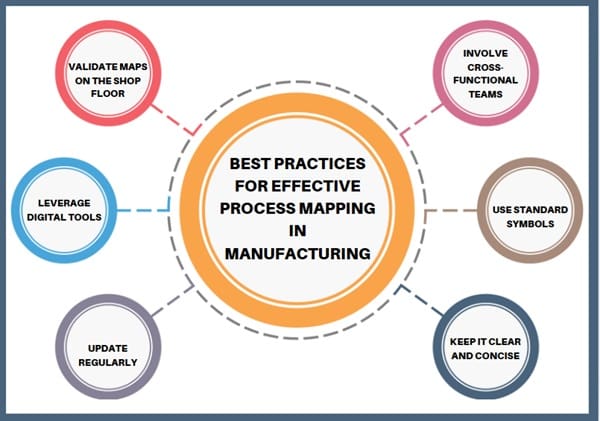
- Involve cross-functional teams: Engage operators, engineers, and supervisors for accurate mapping.
- Use standard symbols: Consistency improves clarity and reduces misinterpretation.
- Keep it clear and concise: Avoid clutter and focus on key steps and flows.
- Update regularly: Reflect changes in processes to maintain relevance.
- Leverage digital tools: Software like Microsoft Visio, Lucidchart, or specialized lean tools streamline creation and sharing.
- Validate maps on the shop floor: Confirm accuracy with real-world observations and feedback.
Final Words
For manufacturing business managers, process maps are more than documentation—they are strategic tools for operational excellence. By mastering the 7 types of process maps, you can:
- Visualize and understand complex workflows
- Identify bottlenecks and eliminate waste
- Improve cross-functional collaboration
- Drive lean manufacturing initiatives
- Enhance quality, efficiency, and customer satisfaction
Integrate process mapping into your continuous improvement framework to sustain competitive advantage.

About Six Sigma Development Solutions, Inc.
Six Sigma Development Solutions, Inc. offers onsite, public, and virtual Lean Six Sigma certification training. We are an Accredited Training Organization by the IASSC (International Association of Six Sigma Certification). We offer Lean Six Sigma Green Belt, Black Belt, and Yellow Belt, as well as LEAN certifications.
Book a Call and Let us know how we can help meet your training needs.


