

Cause and effect analysis, also known as fishbone or Ishikawa diagram, is a visual tool used to identify, explore, and organize possible causes of a specific problem or outcome.
This method helps teams systematically look at all factors that might contribute to an issue and focus efforts on solving the root causes. The diagram, often shaped like a fishbone, helps clarify relationships between causes and their effects.
Table of contents
What is Cause and Effect Analysis?
Cause-and-effect analysis is a powerful tool that helps identify the underlying causes of a problem or issue. By understanding these causes, teams can address them more effectively. This method visualizes the factors contributing to a problem, making it easier to tackle each one.
In its simplest form, cause-and-effect analysis connects an effect (a problem or quality issue) with its potential causes. Teams often represent this analysis using a diagram that highlights these relationships. It is also called an Ishikawa diagram or fishbone diagram due to its shape, which resembles the spine and bones of a fish.
The primary purpose of this analysis is to identify a problem’s potential root causes and organize them into categories. The end goal is to provide a clear view of what contributes to a specific issue so that teams can take corrective action.
Key Elements of Cause and Effect Analysis
- Effect
The effect is the problem or issue being analyzed. It is typically the starting point of the analysis. - Causes
Causes are factors or actions that contribute to the effect. They are classified into primary and secondary categories. - Categories
Causes are grouped into categories to simplify analysis. Common categories include people, processes, materials, machinery, methods, and the environment.
Importance of Cause-and-Effect Analysis

A cause-and-effect diagram is especially useful when:
- Root Cause Identification
It goes beyond surface-level symptoms to pinpoint the actual cause of a problem. - Structured Thinking
The method provides a systematic approach to analyze complex problems logically. - Team Collaboration
It encourages brainstorming and collective problem-solving within teams. - Prevention of Recurrence
By identifying root causes, organizations can implement measures to prevent the issue from reoccurring. - Improved Decision-Making
It enables data-driven decisions by providing a clear understanding of the problem’s origins.
Teams typically use the analysis to solve quality problems, improve processes, and ensure consistent outcomes. This tool helps focus on the issues that need attention and prevents teams from getting lost in irrelevant details.
When Should You Use Cause-and-Effect Analysis?
Teams should use cause-and-effect diagrams in situations where they need to:
- Identify the root causes of a problem.
- Sort out multiple causes contributing to an issue.
- Analyze and improve processes to remove inefficiencies or defects.
- Understand the relationships between various factors influencing an outcome.
By creating a cause-and-effect diagram, teams can get a comprehensive picture of the factors at play. This leads to more effective solutions and better decision-making.
Main Steps in Cause and Effect Analysis

Identify the Problem: Start by clearly defining the problem. Write it in a box at the end of the diagram’s main arrow, called the spine. This box represents the effect or outcome you aim to resolve.
Identify Major Categories of Causes: After defining the problem, identify the primary categories that might contribute to the issue. These usually include materials, methods, machines, manpower, and environment. Represent these categories as arrows branching off the spine.
Identify Possible Causes Within Each Category: For each category, brainstorm and list potential causes contributing to the problem. For instance, under “Materials,” causes may include poor-quality raw materials or improper storage. Draw these causes as branches extending from the category arrows.
Identify Sub-Causes: Analyze each cause to explore deeper sub-causes. Represent these sub-causes as smaller branches stemming from the main causes. For example, if “poor-quality raw materials” is a cause, sub-causes might include supplier issues or inadequate inspections.
Analyze the Diagram: After identifying all causes, evaluate the diagram. Check the logical flow, identify recurring patterns, and assess which causes have the biggest impact on the problem. Focus on these to address the root causes.
Prioritize and Plan Actions: Prioritize the most critical causes and create an action plan. Outline the steps to mitigate or eliminate these causes, assign responsibilities, and set deadlines for completing the actions.
Benefits of Cause and Effect Analysis
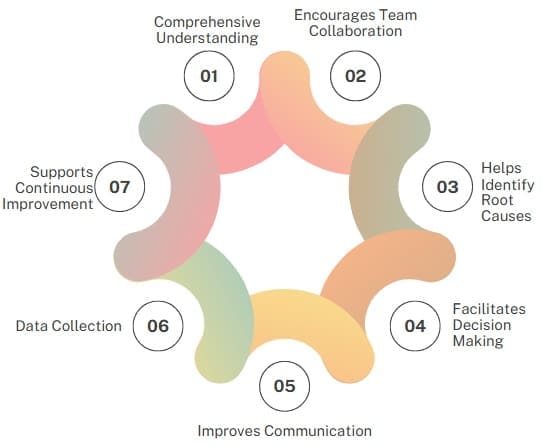
Comprehensive Understanding: Cause and effect analysis provides a structured and detailed understanding of the factors that contribute to a problem. By visually representing these factors, the diagram helps individuals grasp complex issues more easily.
Encourages Team Collaboration: The process encourages group participation. It brings together individuals from various backgrounds to brainstorm and analyze the causes, thus utilizing collective knowledge and expertise.
Helps Identify Root Causes: This technique allows you to dig deeper and focus on the underlying causes of problems rather than just addressing the symptoms. By examining each cause systematically, you can uncover the root issues and solve them effectively.
Facilitates Decision Making: The clear structure of the diagram allows for easier decision-making. By analyzing the potential causes and their impact on the problem, you can prioritize actions and allocate resources to the most critical issues.
Improves Communication: Cause and effect diagrams serve as effective communication tools. They allow teams to present the causes and effects clearly to stakeholders, ensuring that everyone understands the problem and proposed solutions.
Data Collection: The diagram helps identify areas where data needs to be collected. This further aids in the verification of causes and in tracking the effectiveness of implemented solutions.
Supports Continuous Improvement: Cause and effect analysis is an ongoing tool. Once solutions are implemented, you can continue to use the diagram to monitor the problem and refine the process, fostering a culture of continuous improvement.
Tools Used in Cause and Effect Analysis
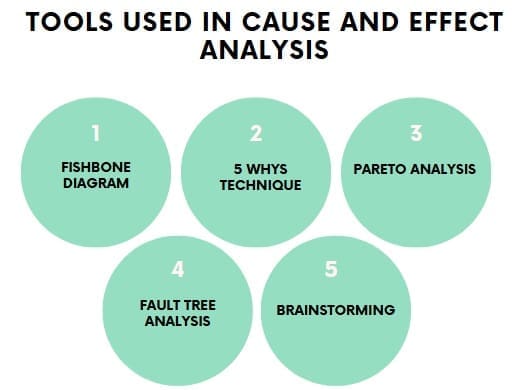
Several tools facilitate Cause and Effect Analysis. Here are the most commonly used ones:
- Fishbone Diagram
The Fishbone Diagram organizes potential causes into categories, resembling the bones of a fish. - 5 Whys Technique
This iterative technique asks “Why?” repeatedly to trace a problem back to its root cause. - Pareto Analysis
This uses the 80/20 principle to identify the most significant causes. - Fault Tree Analysis
This hierarchical diagram represents different events and their relationships leading to a fault. - Brainstorming
This group activity encourages idea generation about potential causes.
Applications of Cause and Effect Analysis
Cause and effect analysis can be applied to various industries and scenarios:
- Manufacturing: It helps identify faults in products or processes and improve quality control.
- Healthcare: It is used to analyze medical errors or patient safety issues.
- Service Industries: It assists in pinpointing factors affecting service delivery, such as delays or customer dissatisfaction.
- Business Management: It is useful in identifying inefficiencies in business operations, helping managers make informed decisions.
Cause and Effect Analysis vs. Root Cause Analysis
- Aspect Cause and Effect Analysis Root Cause Analysis
- Scope Explores all possible causes. Focuses on identifying the root cause.
- Approach Visual and collaborative. Analytical and data-driven.
- Outcome Broad understanding of contributing factors. Specific root cause determination.
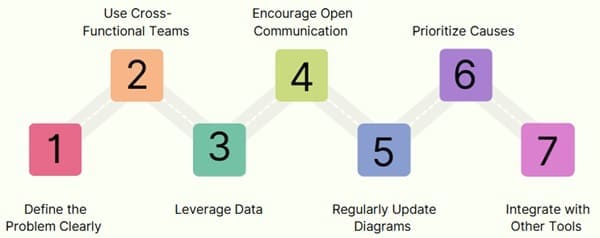
Best Practices for Cause and Effect Analysis
- Define the Problem: Clearly Ensure the problem statement is concise and specific.
- Use Cross-Functional Teams: Involve individuals with different expertise for a well-rounded perspective.
- Leverage Data: Support potential causes with factual evidence whenever possible.
- Encourage Open Communication: Foster an environment where team members feel comfortable sharing ideas.
- Regularly Update Diagrams: Keep the analysis dynamic by revising it as new information arises.
- Prioritize Causes: Focus on the most significant causes to maximize the impact of solutions.
- Integrate with Other Tools: Combine Cause and Effect Analysis with tools like SWOT or FMEA for deeper insights.
Challenges in Cause and Effect Analysis
- Time-Consuming Thorough analysis requires significant time investment.
- Subjectivity Brainstorming can lead to biased or incomplete conclusions if not guided properly.
- Overlooking Data Focusing only on opinions without supporting data can weaken the analysis.
- Complexity For large-scale problems, managing numerous causes and categories can be overwhelming.
Final Words
The cause-and-effect analysis is an invaluable tool for identifying and solving problems in any process. It helps teams break down complex issues into manageable parts, ensuring that solutions are targeted and effective.
By following a structured approach to creating a cause-and-effect diagram, teams can quickly identify the root causes of problems and take the necessary actions to resolve them.

About Six Sigma Development Solutions, Inc.
Six Sigma Development Solutions, Inc. offers onsite, public, and virtual Lean Six Sigma certification training. We are an Accredited Training Organization by the IASSC (International Association of Six Sigma Certification). We offer Lean Six Sigma Green Belt, Black Belt, and Yellow Belt, as well as LEAN certifications.
Book a Call and Let us know how we can help meet your training needs.


