

Table of contents
This Article is the second in a four-part series to show you “How to Complete a Six Sigma Root Cause Analysis.” The Input Map (or X-Map) helps the project team to identify all the Xs (or Inputs) in the process that could potentially affect the Ys (or Outputs) in your lean six sigma project.
The series covers four tools:
- The SIPOC(R) Diagram
- The Input (or Variables) Map
- The C&E Matrix
- The FMEA (Failure Modes and Effects Analysis)
The Core Equation
The Core equation in Six Sigma is Y=f(X1, X2, X3, Xn). In order to understand our “Y” or Output, we must first define our “X’s” or Inputs. The Input Map (or Variables Map) is a tool used to define those Inputs.

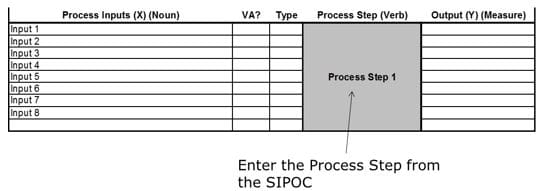
Step #1: Enter the Process Steps
- These steps should become the “P” (Process) in your SIPOC
- There should be no more than 12 steps
- If there are more than 12 steps, you should review your project scope because it may too large
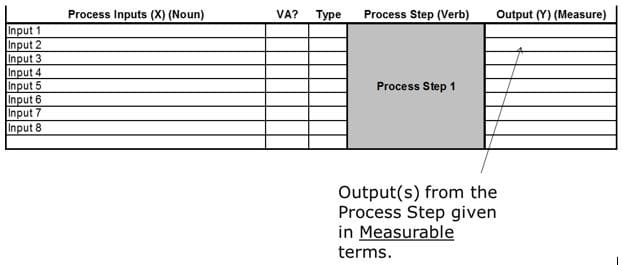
Step #2: List the Process Measurable Outputs
- These are the Measurable Outputs from the Process Step
- The Outputs are related to the Steps, not the Inputs. In other words, I can have 20 inputs in the “Input” column with 3 outputs in the “Output” column
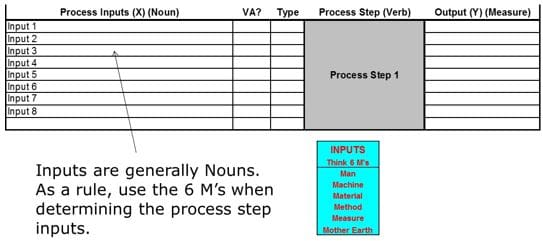
Step #3: Enter the Process Inputs
- As a general rule, the Input should be no more than a 3 word Noun (not an Adverb or Adjective)
- Go to Gemba, Walk the Process, and take notes of all Inputs to the Process. Don’t determine that an Input is insignificant and do not write in on the Input Map. We will use a tool called the C&E Matrix to sift out the Unimportant “Inputs.”

Step #4: List the “Type” of the Variable as “U” or “C”
- Controllable (C): Inputs that you can adjust while the process is in action
- Example: While in the process of mowing a lawn, you can adjust the height of the mower or the speed at which you push the mower
- Uncontrollable (U): These are Inputs that you either can’t control or are unwilling to control (because of cost, company politics, etc.)
- While mowing a lawn, you cannot control the weather as it can change from sunny to rainy.

Once the Input Map is completed and the X’s or Inputs in the Process have been identified, then you can move to the next step. The next step in the Six Sigma Root Cause Analysis is the C&E Matrix where we will Prioritize the Inputs by their Effect on the Outputs. Below is an example of an Input (or Variables) Map with the first two steps completed:

Conclusion
The Input Map (or X-Map) helps the project team to identify all the Xs (or Inputs) in the process that could potentially have an effect on the Ys (or Outputs).
How could the Input Map help you in your project?
Let us know in the comments below!


In the Final Assy step, what will be the output in case of a decision point is present?
For example, if I have these steps:
1. Setup
2. Apply the peanut butter
3. Apply the Jelly
4. Final Assy
5. Pass sandwich to customer
The step number 5 has a decision point: the customer may require a slice sandwich into 2 halves or not. When making the input map, what is the output in the step number 5?
Henry, The Outputs would be the measurable outputs from each decision. Remember that the goal of an input map is to track the inputs to a process so we can Pareto those inputs in the C&E Matrix and then determine their Failure Modes in the FMEA. The Input Map doesn’t care about the actual decision being made as would a process flow map.