Upper Control Limit (UCL) represents the maximum acceptable value in statistical process control charts. This critical boundary helps manufacturers identify when processes exceed normal variation limits. Furthermore, UCL works alongside Lower Control Limit (LCL) to create control boundaries.
Statistical process control relies heavily on these limits for quality assurance. Moreover, UCL enables organizations to detect process variations before they become quality issues. Therefore, understanding UCL is essential for effective quality control implementation.
Table of contents
What is a Control Chart?
A control chart is a graphical tool used in statistical process control. It monitors process performance over time. By plotting data points, it identifies variations in a process. Control charts include three main lines: the centerline, UCL, and Lower Control Limit (LCL). These lines help determine if a process is stable or needs adjustment.
Control charts, also called Shewhart charts, are vital for quality control. They allow businesses to detect trends, shifts, or anomalies. For instance, a process control chart can reveal if production is consistent or deviating. Understanding these charts is essential for applying the UCL effectively.
Public, Onsite, Virtual, and Online Six Sigma Certification Training!
- We are accredited by the IASSC.
- Live Public Training at 52 Sites.
- Live Virtual Training.
- Onsite Training (at your organization).
- Interactive Online (self-paced) training,
Types of Control Charts
There are several types of control charts, each suited for specific data:
- X-bar Chart: Monitors the process mean.
- R-Chart: Tracks process variability.
- P-Chart: Analyzes the proportion of defective items.
- C-Chart: Counts defects in a constant sample size.
Each chart uses UCL and LCL to set boundaries for acceptable performance.
What is the Upper Control Limit (UCL)?
The Upper Control Limit (UCL) is the maximum threshold for process variation. It is calculated using statistical methods, typically set at three standard deviations above the process mean. If data points exceed the UCL, the process may be out of control. This signals the need for investigation and corrective action.
UCL works alongside the Lower Control Limit (LCL), which marks the lower boundary. Together, they define the range of normal process variation. Staying within these limits indicates a stable process.
Upper Control Limit Formula and Calculations
Basic UCL Formula Structure
The fundamental UCL formula follows this pattern: UCL = Process Mean + (Control Factor × Standard Deviation)
However, specific formulas vary depending on chart types and sample sizes. Additionally, control chart constants help standardize calculations across different scenarios.
UCL Formula for X-bar Charts
For X-bar charts with variable sample sizes: UCL = X̄ + A₂ × R̄
Where:
- X̄ represents the process mean
- A₂ is the control chart constant
- R̄ represents the average range
UCL Formula for Individual Charts
Individual measurement charts use this formula: UCL = X̄ + 2.66 × MR̄
Here, MR̄ represents the average moving range between consecutive measurements.
Three Sigma Control Limits
Most control charts employ three sigma control limits for statistical significance. This approach captures approximately 99.73% of normal process variation. Consequently, data points beyond these limits likely indicate special causes.
Three sigma limits provide balanced sensitivity to process changes. Moreover, they minimize false alarms while detecting genuine quality issues effectively.
Why is UCL Important?
UCL is critical for maintaining quality in manufacturing, healthcare, and other industries. It helps identify when a process deviates from its norm. For example, a sudden spike in defects might push data points above the UCL. This alerts managers to investigate potential causes, such as equipment failure or human error.
By using UCL, businesses can:
- Ensure consistent product quality.
- Reduce waste and rework.
- Improve operational efficiency.
- Meet customer expectations.
Also See: Seven Basic Quality Control Tools
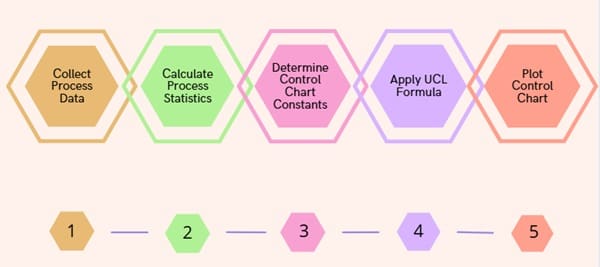
How to Calculate Upper Control Limit (UCL)?

Step 1: Collect Process Data
Begin by gathering representative process measurements over sufficient time periods. Additionally, ensure data reflects typical operating conditions without known special causes.
Sample sizes should remain consistent when possible. Furthermore, collect data at regular intervals to capture natural process variation.
Step 2: Calculate Process Statistics
Determine the process mean (X̄) by averaging all measurements. Next, calculate the range (R) for each subgroup. Then, compute the average range (R̄) across all subgroups.
These statistics form the foundation for UCL calculations. Therefore, accuracy in this step ensures reliable control limits.
Step 3: Determine Control Chart Constants
Select appropriate control chart constants based on sample size. Standard tables provide these constants for different subgroup sizes. Additionally, these constants account for statistical distribution properties.
Common constants include A₂, D₃, and D₄ for different chart applications.
Step 4: Apply UCL Formula
Insert calculated statistics into the appropriate UCL formula. Subsequently, perform the mathematical calculations to determine the upper control limit.
Double-check calculations to ensure accuracy. Moreover, verify that results align with expected process behavior.
Step 5: Plot Control Chart
Create the control chart with centerline, UCL, and LCL clearly marked. Then, plot individual data points to visualize process performance.
This visual representation enables quick identification of out-of-control conditions.
UCL and LCL
Upper and lower control limits function as complementary boundaries for process monitoring. While UCL identifies excessive values, LCL detects insufficient ones. Together, they create a control zone for acceptable process variation.
The relationship between UCL and LCL reflects process capability and stability. Wider control limits suggest greater natural variation. Conversely, tighter limits indicate more consistent processes.
Both limits use similar calculation principles but with opposite mathematical operations. Therefore, understanding UCL concepts applies directly to LCL calculations.
Using a UCL Calculator
Manually calculating UCL can be time-consuming. A UCL calculator simplifies the process. These tools require inputs like sample size, mean, and range. They then compute UCL and LCL instantly. Many SPC software programs, such as Minitab or Excel, include built-in UCL calculators.
Also Read: Statistical Process Control (SPC) Charts
How to Create a Control Chart in Excel?
Excel is a powerful tool for creating SPC charts. Follow these steps to build a control chart with UCL and LCL:
- Enter Data: Input your process data into an Excel spreadsheet.
- Calculate Averages: Use Excel formulas to compute X̄ and R̄.
- Determine Control Limits: Apply the UCL and LCL formulas.
- Plot the Chart: Use Excel’s charting tools to create a line graph.
- Add UCL and LCL Lines: Insert horizontal lines for UCL and LCL.
For detailed steps, check our guide on creating control charts in Excel.
Understanding 3 Sigma Control Limits
UCL is often set at three standard deviations (3 sigma) above the mean. This is based on statistical principles, where 99.73% of data falls within three standard deviations in a normal distribution. The 3 sigma control limits ensure that only extreme variations trigger action.
For instance, if a process mean is 100 and the standard deviation is 5, the UCL is:
UCL = 100 + (3 × 5) = 115
This approach minimizes false alarms while catching significant deviations.
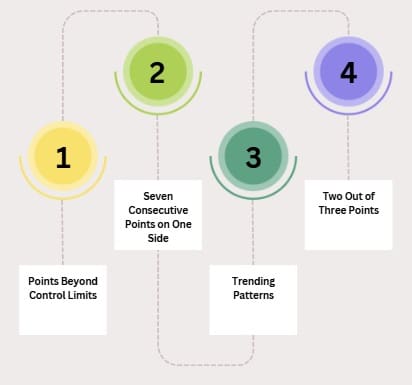
SPC Rules and Control Chart Interpretation

Statistical process control rules help interpret control chart signals systematically. These rules identify various out-of-control patterns beyond simple limit violations.
Rule 1: Points Beyond Control Limits
Any point exceeding UCL or falling below LCL indicates potential special causes. Immediate investigation and corrective action become necessary.
Rule 2: Seven Consecutive Points on One Side
Seven consecutive points above or below the centerline suggest process shifts. This pattern often precedes limit violations.
Rule 3: Trending Patterns
Six consecutive increasing or decreasing points indicate systematic process changes. Early detection prevents quality degradation.
Rule 4: Two Out of Three Points
Two out of three consecutive points in the outer third zone warrant attention. This pattern suggests increasing process variation.
Practical Examples of UCL in Action
Let’s explore real-world examples of UCL in statistical process control:
Manufacturing
A factory produces bolts with a target length of 10 cm. Using an X-bar chart, they calculate a UCL of 10.2 cm. If a sample exceeds this limit, they inspect machinery for calibration errors.
Healthcare
A hospital tracks patient wait times. The UCL is set at 45 minutes. If wait times exceed this, staff investigate bottlenecks, such as staffing shortages.
Retail
A retailer monitors daily sales. If sales drop below the LCL or spike above the UCL, they analyze factors like promotions or supply chain issues.
These examples show how UCL helps maintain consistency across industries.
Common UCL Calculation Mistakes to Avoid
Using Insufficient Data
Insufficient historical data leads to unreliable control limits. Minimum sample sizes ensure statistical validity.
Generally, 20-25 subgroups provide adequate baseline data. However, stable processes may require more extensive histories.
Ignoring Process Changes
UCL calculations must reflect current process conditions. Historical limits become invalid after significant process modifications.
Equipment upgrades, material changes, and procedure updates necessitate control limit recalculation.
Mixing Different Processes
Combining data from different processes creates misleading control limits. Each unique process requires separate statistical analysis.
Similar products from different production lines often have distinct variation patterns.
Benefits of Proper UCL Implementation
Early Problem Detection
UCL enables proactive quality management by identifying issues before customer impact. Early detection reduces correction costs and prevents defective products.
Objective Decision Making
Statistical control limits remove subjectivity from quality decisions. UCL provides quantitative criteria for process interventions.
Reduced Variability
Consistent UCL monitoring helps reduce process variability over time. Operators become more aware of variation sources and their impacts.
Improved Customer Satisfaction
Better process control translates directly to improved product quality. Consistent performance builds customer confidence and loyalty.
Frequently Asked Questions (FAQ) on UCL
What is the difference between UCL and specification limits?
UCL represents statistical control boundaries based on process variation, while specification limits define customer requirements. UCL helps maintain process stability within specification ranges.
How often should control limits be recalculated?
Recalculate control limits after significant process changes, equipment modifications, or when accumulating sufficient new data. Stable processes may require annual reviews.
Can UCL be used for non-manufacturing processes?
Yes, UCL applies to any measurable process including service delivery, administrative tasks, and project management activities. The principles remain consistent across industries.
What should I do when a point exceeds the UCL?
Investigate immediately to identify the special cause. Document findings, implement corrections, and monitor subsequent performance to ensure effectiveness.
How many data points are needed to calculate reliable UCL?
Minimum 20-25 subgroups provide adequate statistical foundation. However, more data improves control limit accuracy and process understanding.
Is it possible to have processes without control limits?
All processes have natural variation requiring statistical boundaries. However, some processes may need different control chart types or specialized calculation methods.


