Table of contents
Estimated reading time: 4 minutes
Statistical Process Control (SPC) Charts
Statistical Process Control (SPC) chart types are graphical tools used in quality control and process management to monitor and analyze variations or changes in a process over time. They are a fundamental component of quality management systems, allowing businesses to assess and improve the consistency and stability of their processes.
SPC chart types, also known as control charts, display plotted data points (such as measurements or observations) against predefined control limits. These charts help identify variations that might occur naturally within a process (common cause variation) and those that result from specific issues or changes (special cause variation).
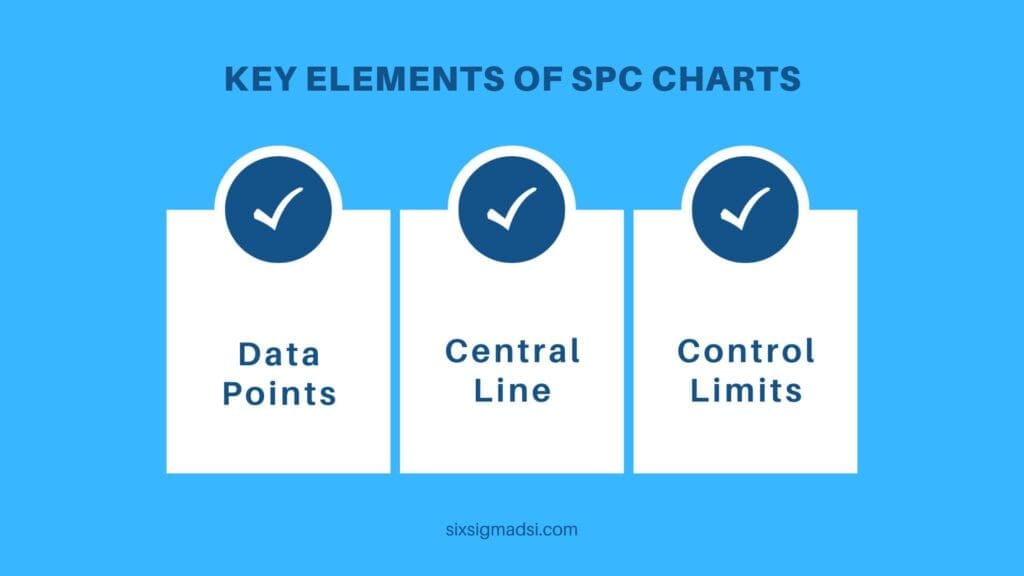
Key elements of SPC charts

- Data Points: These represent measurements or observations taken from the process being monitored. They are plotted chronologically on the chart.
- Central Line: Also called the process average line, it represents the mean or average value of the data points. It’s typically the midpoint of the control chart.
- Control Limits: Upper and lower control limits (UCL and LCL, respectively) are calculated based on statistical formulas from the data. They indicate the boundaries within which the process should operate under normal, stable conditions.
Common types of SPC charts
- X-bar and R Charts: X-bar charts monitor the average values of samples taken from a process, while R charts monitor the range or variation within those samples.
- Individuals and Moving Range (I-MR) Charts: Individuals charts track individual measurements or observations, while the moving range chart plots the difference between consecutive data points.
- P and NP Charts: P charts monitor the proportion of defective items in a sample, while NP charts monitor the number of defective items.
- C and U Charts: C charts track the count of defects per unit, whereas U charts monitor the number of defects in a sample.
By analyzing patterns and trends in the plotted data against the control limits, SPC charts enable practitioners to determine whether a process is in control (when variations are due to common causes) or out of control (when special causes are present). This information helps in identifying problems, initiating corrective actions, and maintaining consistency in quality standards within a process.
SPC charts play a crucial role in continuous improvement efforts by providing a systematic method to monitor and manage processes, ultimately leading to enhanced quality, reduced waste, and increased efficiency in various industries.
Applies of SPC Charts
Statistical Process Control (SPC) chart types are versatile tools that can be applied across various industries and processes. They are particularly useful in situations where consistent quality control and process stability are essential. Here are some scenarios and industries where SPC charts can be effectively utilized:
- Manufacturing: SPC charts are commonly used in manufacturing industries (e.g., automotive, electronics, pharmaceuticals) to monitor production processes, ensure product quality, and detect deviations that could lead to defects or inconsistencies in output.
- Healthcare: In healthcare settings, SPC charts can be applied to monitor patient outcomes, track medical processes, and maintain quality standards in areas like hospital operations, laboratory testing, and medical device manufacturing.
- Service Industry: SPC charts can help service-oriented businesses (e.g., hospitality, banking, telecommunications) monitor and improve service quality, customer satisfaction, and operational processes.
- Software Development: SPC techniques can be adapted to track and manage software development processes, identify and address defects or issues in coding, and enhance the efficiency of software production.
- Supply Chain Management: SPC charts can be used in logistics and supply chain management to monitor and manage various processes such as inventory management, order fulfillment, and transportation operations.
- Agriculture and Food Processing: SPC methods are applied in agriculture to monitor crop yields, and quality of produce, and in food processing to maintain food safety standards and ensure product consistency.
- Energy and Utilities: SPC charts can help in monitoring energy production processes, ensuring reliability, and identifying and mitigating issues that could affect output or distribution.
- Research and Development: SPC techniques can aid in research and development by monitoring experimental processes, ensuring reproducibility of results, and maintaining consistency in testing procedures.
SPC charts are valuable whenever there is a need to continuously monitor processes, detect variations, distinguish between common and special causes of variation, and take corrective actions to improve quality, efficiency, and reliability. Their flexibility and adaptability make them a valuable asset in various industries where maintaining consistent and high-quality processes is essential.


