
Multi-Vari analysis is a graphical tool that finds where variation hides in a process. It sorts variation into three families: positional variation (differences within one piece), cyclical variation (differences from piece to piece), and temporal variation (differences over time).
A Multi-Vari chart plots real measurements against these three categories, so a team can see which type of variation dominates before running deeper statistical tests. This step matters because it narrows a wide list of suspects down to one category, saving time before a team commits to a full DMAIC investigation or a formal ANOVA test.
Quick-Reference Table: The Three Variation Families
| Variation Type | What It Compares | Example |
| Positional (within-piece) | Differences within a single unit | Wall thickness varies across one molded part |
| Cyclical (piece-to-piece) | Differences between consecutive units | Part 1 differs from part 2 differs from part 3 |
| Temporal (time-to-time) | Differences across shifts, days, or batches | Morning output differs from afternoon output |
Table of contents
Key Takeaways
- Multi-Vari analysis sorts variation into three families, not one general bucket called “variation.”
- A Multi-Vari chart is a graph, not a statistical test on its own. It points a team toward the right test to run next.
- Positional variation lives inside a single part. It shows up when one item measures differently depending on where you measure it.
- Cyclical variation lives between consecutive parts. It shows up when part-to-part differences appear even under the same conditions.
- Temporal variation lives across time. It shows up when shifts, days, or batches differ from each other.
- Nested ANOVA can confirm what the chart suggests. The chart shows the pattern first; the statistical test confirms it second.
What Is Multi-Vari Analysis?
Multi-Vari analysis is a method for studying variation using logical subgroups. It answers a specific question: does the biggest source of variation come from within a single part, between parts, or across time?
Most process measurements assume one value represents the whole. A furnace’s temperature reading assumes the whole furnace sits at one temperature. That assumption often fails. A furnace’s cross-section can run hotter in one spot than another. A molded part can measure thicker at one edge than another. Multi-Vari analysis exists to catch exactly this kind of hidden variation.

Public, Onsite, Virtual, and Online Six Sigma Certification Training!
- We are accredited by the IASSC.
- Live Public Training at 52 Sites.
- Live Virtual Training.
- Onsite Training (at your organization).
- Interactive Online (self-paced) training,
The Three Types of Variation, Explained Clearly
Multi-Vari analysis rests on three named variation types. Confusing these three is the most common mistake teams make with this tool.
Positional Variation (Within-Piece)
Positional variation happens inside a single unit. If you measure the same part at five different points, and the five measurements differ, that difference is positional variation.
Example: A sheet of metal measures thicker in the center than at the edges.
Cyclical Variation (Piece-to-Piece)
Cyclical variation happens between consecutive units made under the same conditions. If part 1, part 2, and part 3 come off the same machine in a row, and their measurements differ, that difference is cyclical variation.
Example: Five consecutive bottles filled by the same machine each hold a slightly different volume.
Temporal Variation (Time-to-Time)
Temporal variation happens across a longer time window, like shifts, days, weeks, or batches. If the morning shift’s average output differs from the afternoon shift’s average output, that difference is temporal variation.
Example: A process runs tighter to spec in the morning than after a shift change in the afternoon.
Why Sorting Variation This Way Matters
A team that treats all variation the same wastes time chasing the wrong cause. If the real problem is positional, meaning it lives inside each individual part, then comparing shift-to-shift averages will never find it. If the real problem is temporal, then focusing on a single part’s internal measurements will miss it entirely.
Multi-Vari analysis forces a team to check all three categories before deciding where to dig deeper. This single step often saves weeks of investigating the wrong variable.
How to Build a Multi-Vari Chart
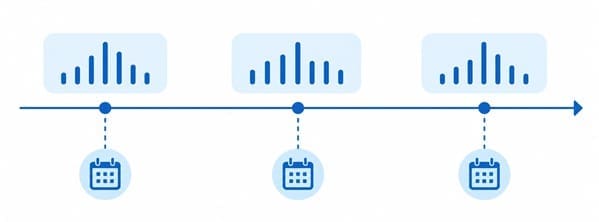
A Multi-Vari chart plots real measurements to reveal which variation type dominates. Follow these steps to build one correctly.
- Select the process and characteristic to study. Pick one measurable output, like part thickness, fill volume, or cycle time.
- Choose a sample size and sampling frequency. A common approach measures several points within each part, several consecutive parts, and repeats this across several time periods.
- Set up a data collection sheet. Record the time, the part, and the specific measurement location for every data point.
- Plot the chart. Put time along the horizontal axis. Put the measured values on the vertical axis. Draw a short vertical line for each part, showing the spread of its within-piece measurements.
- Connect related points. Link the individual part lines across the chart, so both within-piece spread and piece-to-piece spread become visible together.
- Read the pattern. Look for which variation type shows the widest spread: within each line (positional), between lines close together (cyclical), or between groups of lines further apart in time (temporal).
- Investigate the dominant variation type further. Once the chart points to one category, run more targeted studies or a nested ANOVA to confirm the finding statistically.
- Repeat the study after making changes. A Multi-Vari study run before and after a process fix confirms whether the fix actually worked.
Also Read: Current State Analysis: What It Is, Tools, and How to Do It
A Worked Example: Injection-Molded Part Thickness

A plant molds a plastic housing and wants to know why thickness varies. The tolerance calls for 2.0 mm, plus or minus 0.1 mm.
The team measures thickness at three points on each part (top, middle, bottom), across five consecutive parts, during three shifts.
| Variation Type | What the Data Shows |
| Positional | Each part measures about 0.02 mm thinner at the top than the middle. Small and consistent. |
| Cyclical | Consecutive parts within the same shift vary by about 0.01 mm. Very small. |
| Temporal | The night shift averages 0.08 mm thinner than the day shift. Large and inconsistent. |
The chart points clearly to temporal variation. The real difference comes from something that changes between shifts, not from something that changes within a part or between consecutive parts. This narrows the investigation to shift-specific factors, like mold temperature settings, operator technique, or raw material batch changes between shifts.
Without this step, a team might have wasted time adjusting the mold’s internal geometry, which the data shows is not the actual source of the problem.
How Multi-Vari Analysis Fits Into DMAIC
Multi-Vari analysis typically appears during the Measure or early Analyze step of a DMAIC project, right after a team has confirmed a process problem exists but before committing to a specific root cause theory.
This tool works as a screening step, not a final answer. It narrows a wide field of possible causes down to one variation family. From there, a team runs more specific tools, like a fishbone diagram, hypothesis testing, or a nested ANOVA, to confirm the exact root cause within that category.
Multi-Vari Chart vs. Nested ANOVA: How They Work Together
A Multi-Vari chart is visual and fast to build. A nested ANOVA is statistical and confirms the pattern with a p-value.
| Tool | What It Does | When to Use It |
| Multi-Vari chart | Shows the pattern visually across the three variation types | First step, to screen for the dominant variation source |
| Nested ANOVA | Quantifies how much variation each level (position, piece, time) contributes | Second step, to confirm the chart’s pattern with statistics |
Using the chart first, then confirming with nested ANOVA, gives a team both a fast visual read and a defensible statistical result.
Also Read: What is Attribute Agreement Analysis?
Common Mistakes with Multi-Vari Analysis
Skipping the within-piece measurements. A team that only measures one point per part can never detect positional variation, because the data needed to see it was never collected.
Sampling too few time periods. Temporal variation only shows up if the study spans enough shifts, days, or batches to capture a real pattern, not just a single snapshot.
Confusing cyclical variation with random noise. A small, consistent piece-to-piece difference is real cyclical variation. A team should not dismiss it just because it looks minor next to a larger temporal effect.
Stopping at the chart without statistical confirmation. The chart shows a visual pattern, not a certainty. A nested ANOVA should confirm the pattern before a team commits significant resources to a fix.
Frequently Asked Questions (FAQs) on Multi-Vari Analysis
What is Multi-Vari analysis in simple terms?
Multi-Vari analysis is a graphical method that sorts process variation into three types, positional, cyclical, and temporal, to find which one causes the most trouble before a team investigates further.
What are the three types of variation in Multi-Vari analysis?
Positional variation happens within a single part. Cyclical variation happens between consecutive parts made under the same conditions. Temporal variation happens across time, such as between shifts, days, or batches.
How do you build a Multi-Vari chart?
Select a process characteristic to measure, sample multiple points within each part across several consecutive parts, and repeat this over multiple time periods. Plot the values with time on the horizontal axis, then look for which variation type shows the widest spread.
When should you use Multi-Vari analysis instead of ANOVA?
Use Multi-Vari analysis first, as a visual screening step, to narrow down which variation type matters most. Follow it with a nested ANOVA to confirm the pattern statistically once the chart has pointed you toward one variation family.
What is an example of positional variation?
A metal sheet that measures thicker in the center than at its edges shows positional variation, since the difference exists within one single unit.
What is an example of temporal variation?
A process that performs differently on the night shift compared to the day shift shows temporal variation, since the difference appears across time rather than within or between individual parts.
Where does Multi-Vari analysis fit in a Six Sigma project?
It typically appears during the Measure or early Analyze step of DMAIC, helping a team narrow a wide list of possible causes down to one variation type before committing to a specific root cause investigation.
Final Words
Multi-Vari analysis solves a specific problem: it stops a team from guessing which type of variation actually drives a process problem. By sorting variation into positional, cyclical, and temporal categories, and plotting real measurements across all three, a team can see the pattern before spending weeks chasing the wrong cause.
A Multi-Vari chart shows the pattern fast. A follow-up nested ANOVA confirms it with real statistical backing, giving a team both a fast first look and a defensible final answer.
Build Your Root Cause Skills with SSDSI
Finding the real source of variation, instead of guessing, is exactly what separates a trained Six Sigma practitioner from an educated guess.
SSDSI delivers IASSC-accredited Green Belt and Black Belt training that covers Multi-Vari analysis, nested ANOVA, and the full DMAIC root cause toolkit, through onsite, live virtual, public, and self-paced formats.
SSDSI has certified 5,322+ professionals across 600+ organizations in 52 cities, backed by a 5-star Google review rating. If you want to build this skill properly, a conversation about the right certification path is a solid next step.
About Six Sigma Development Solutions, Inc.
Six Sigma Development Solutions, Inc. offers onsite, public, and virtual Lean Six Sigma certification training. We are an Accredited Training Organization by the IASSC (International Association of Six Sigma Certification). We offer Lean Six Sigma Green Belt, Black Belt, and Yellow Belt, as well as LEAN certifications.
Book a Call and Let us know how we can help meet your training needs.


