
Not all patterns in your data mean the same thing.
A process that produces more defects on Mondays has a different root cause than one that drifts high every six months. A sales operation that peaks every December is dealing with something different from one that follows a four-year business cycle of growth and contraction.
These distinctions matter in Six Sigma because the type of variation you are dealing with determines how you respond to it. Treating a long-wave cyclical pattern as random noise means missing a predictable, manageable source of process or demand variation. Treating a true cycle as if it were an isolated special cause means misdiagnosing the problem and applying the wrong fix.
This article explains what cyclical variation is, how it differs from seasonal and other types of variation, where it shows up in manufacturing and business processes, how to identify it, and what organizations can do when they find it.
Table of contents
What Is Cyclical Variation?
Cyclical variation is a repeating, wave-like pattern in data that occurs over an extended time period — typically longer than one year — but without a fixed, predictable frequency.
The pattern fluctuates above and below the long-term trend of a process or data series in a recognizable rhythm: periods of higher-than-average output, performance, or demand, followed by periods of lower-than-average, and back again. The cycle repeats, but the timing and magnitude of each wave can differ.
This is the key characteristic that separates cyclical variation from seasonal variation. Seasonal patterns are tied to the calendar — they happen at the same time each year with roughly the same magnitude. Cyclical patterns are not calendar-bound. They are driven by broader economic, market, or operational forces that fluctuate over multi-year periods.
In time series analysis — the statistical study of data collected over time — cyclical variation is one of four recognized components:
- Trend: The long-term direction of the data (upward, downward, or flat) over many years
- Seasonal variation: Regular, calendar-driven fluctuations that repeat within a 12-month period
- Cyclical variation: Longer-wave fluctuations that recur over multi-year periods without a fixed frequency
- Irregular variation: Random, unpredictable fluctuations that cannot be attributed to trend, seasonality, or cycles
Understanding which component you are seeing in your data is the starting point for responding correctly.

Public, Onsite, Virtual, and Online Six Sigma Certification Training!
- We are accredited by the IASSC.
- Live Public Training at 52 Sites.
- Live Virtual Training.
- Onsite Training (at your organization).
- Interactive Online (self-paced) training,
Cyclical Variation vs. Seasonal Variation: The Critical Difference
Because both cyclical and seasonal variation involve repeating patterns, they are frequently confused. The distinction matters for how you plan and respond.
Seasonal variation is predictable and calendar-bound. It repeats at the same point in the calendar year, every year, with a relatively consistent magnitude. Ice cream sales peak in summer. Retail traffic surges in November and December. Hospital admissions for flu rise every January. You can plan for seasonal variation with a high degree of confidence because the timing is reliable.
Cyclical variation is partially predictable but not calendar-bound. The pattern repeats, but not on a fixed schedule. The construction industry expands and contracts with housing markets. Manufacturing output follows economic business cycles that may last five to seven years before reversing. A supplier’s lead times may tighten cyclically as capacity utilization across the industry rises and falls. You can anticipate cyclical variation directionally — recognizing where in the cycle you are — but you cannot schedule it the way you can schedule seasonal demand.
A quick test: if the variation repeats within one calendar year and aligns with the same calendar period each time, it is seasonal. If the variation spans multiple years and the precise timing shifts from cycle to cycle, it is cyclical.
Both types are systematic and manageable. Neither should be mistaken for the random, unpredictable irregular variation that represents the floor-level noise of a process.
Also Read: Lean Six Sigma in Remote Work: Eliminating Waste and Reducing Variation
Cyclical Variation vs. Common Cause and Special Cause Variation
In the Six Sigma framework, process variation is classified as either common cause or special cause:
Common cause variation (also called natural or random variation) is the inherent, background variation present in every process when it is running in a stable, controlled state. It is the result of many small, unavoidable sources of variation interacting. Reducing common cause variation requires changing the fundamental design of the process itself — not reacting to individual data points.
Special cause variation is variation from an identifiable, non-random source — something outside the normal process behavior. It shows up as points outside control limits, runs, trends, or unusual patterns on a control chart. It is assignable to a specific cause and requires investigation and correction.
Cyclical variation falls in a nuanced middle ground. In many cases, it represents a special cause that is systematic rather than isolated — a repeating pattern with an identifiable driver, rather than a one-time occurrence. Identified and understood, it can be managed. Unidentified, it looks like unusual control chart behavior that teams cannot explain and therefore cannot fix.
The practical implication: when a control chart shows a consistent wave-like pattern — alternating high and low periods repeating over a predictable timeframe — that is likely cyclical variation. It deserves investigation into its cause, not just a reaction to individual out-of-control points.
Where Cyclical Variation Appears in Manufacturing and Business
Cyclical variation shows up across a wide range of operational and business contexts. Here are the most common sources practitioners encounter.
Economic and Business Cycles
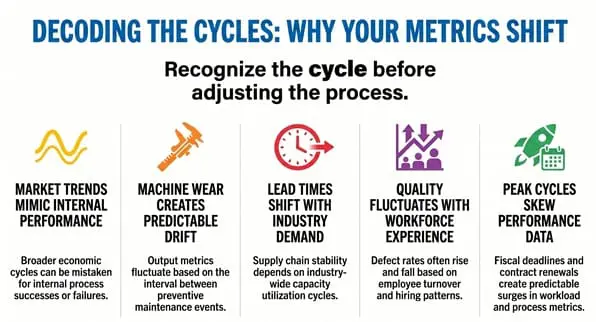
Capital equipment orders, construction activity, industrial production, and raw material prices all fluctuate with broader economic cycles. Organizations that do not account for where they are in the business cycle when reading their performance data risk misattributing normal cyclical performance to internal process failures — or, conversely, crediting internal improvements for what is actually a market tailwind.
A Six Sigma team investigating why scrap rates are rising needs to consider whether raw material quality is cyclically affected by supplier capacity constraints — a known feature of commodity materials markets when demand is high.
Equipment and Maintenance Cycles
In manufacturing, equipment degrades gradually over a maintenance cycle. A machine that produces output within specification after a preventive maintenance event will drift slowly out of optimal performance as wear accumulates, then be restored at the next maintenance. This creates a recognizable cyclical pattern in process output metrics — not seasonal, not random, but cyclical with a period tied to the maintenance interval.
When this pattern is not recognized, teams often chase individual data points on the control chart instead of addressing the degradation cycle systematically.
Supply Chain and Lead Time Cycles
Supplier lead times and component availability often fluctuate cyclically with industry-level capacity utilization. When demand across an industry peaks and capacity tightens, lead times lengthen. As demand cools and new capacity comes online, lead times shorten. These cycles may span 18 months to several years and have a direct impact on inventory management, production scheduling, and process stability.
Labor and Skill Cycles
In industries with high workforce turnover, organizations experience cyclical swings in output quality and process consistency. As experienced employees leave and are replaced by newer workers, defect rates may rise before stabilizing as the new workforce builds competence. This can follow a recognizable cycle tied to workforce demographics or seasonal hiring patterns in certain industries.
Process Capacity and Workload Cycles
In service and transactional environments, workload often cycles with contract renewals, fiscal year-end activity, product launch cycles, or regulatory filing deadlines. These cycles affect process performance metrics in ways that can mislead teams who analyze performance data without separating cyclical patterns from the underlying process capability.
Also Read: Six Sigma in SaaS: Reducing Defects, Churn, and Process Variation
How to Identify Cyclical Variation in Your Data
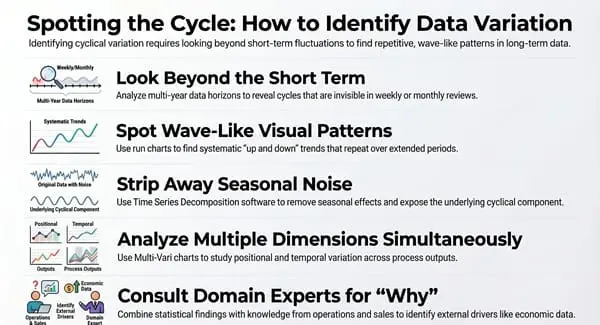
Recognizing cyclical variation requires looking at data over a long enough time horizon. If you are only reviewing a few weeks of data, you will not see a multi-year cycle. Here are the methods most commonly used.
Visual Inspection of Run Charts and Control Charts
Plot your data over an extended period — ideally several years if available. Look for wave-like, alternating high and low patterns that repeat. Cyclical variation often shows up as a series of points trending up for an extended period, then trending down for an extended period, then up again — visible on a run chart even before applying control limits.
On a control chart, cyclical patterns may not trigger individual out-of-control signals but will appear as systematic patterns that are difficult to explain as random. The Western Electric rules and Nelson rules for control chart interpretation include pattern tests specifically designed to catch non-random behavior that does not cross individual control limits.
Time Series Decomposition
Time series decomposition is a formal statistical method that separates a data series into its trend, seasonal, cyclical, and irregular components. Software tools including Minitab, JMP, R, and Python’s statsmodels library all support time series decomposition. Once the trend and seasonal effects are removed, the cyclical component — if present — becomes much more visible in the residual data.
This approach is particularly useful when seasonal variation is large enough to mask the cyclical pattern underneath it.
Multi-Vari Analysis
Multi-vari analysis, used in the Analyze phase of DMAIC, studies variation across multiple dimensions simultaneously — including positional variation, cyclical variation, and temporal variation. A multi-vari chart organized by time period can reveal systematic cyclical patterns in process output that would not be apparent from standard control charts alone.
Process Knowledge and Domain Context
Statistical methods identify patterns. Explaining them requires process knowledge. Once a cyclical pattern is detected in the data, the next step is identifying the driver — which often requires discussion with operations, procurement, maintenance, or sales teams who understand the external forces affecting the process. Economic data, maintenance logs, supplier performance records, and workforce data are all potential inputs.
What to Do When You Identify Cyclical Variation
Finding a cyclical pattern in your data is not, by itself, a problem. Many cyclical patterns are external to the process and cannot be eliminated. The response depends on whether the cycle is driven by factors inside or outside the organization’s control.
External Cycles: Plan and Anticipate
When cyclical variation is driven by external factors — economic conditions, market demand, commodity prices, regulatory activity — the goal is anticipation and preparation, not elimination. Organizations that understand the cycles affecting their business can:
- Adjust inventory levels in advance of demand cycles rather than reacting to shortages or surpluses
- Plan workforce levels and training ahead of cyclical workload peaks
- Time capital investments to align with favorable points in equipment or capacity cycles
- Build supply chain flexibility to absorb cyclical lead time fluctuations without impacting production
This is the supply chain and operations planning application of cyclical variation analysis — not a Six Sigma improvement project, but a strategic planning input.
Internal Cycles: Investigate and Reduce
When cyclical variation is driven by internal factors — equipment maintenance cycles, batch-to-batch raw material variation, seasonal workforce changes — there is often an opportunity to reduce the amplitude of the cycle or eliminate it altogether.
A maintenance cycle that causes process drift can be addressed by shortening the maintenance interval, improving predictive maintenance to catch drift earlier, or redesigning the component that degrades. A cyclical pattern in defect rates tied to workforce turnover can be addressed with improved onboarding, standardized work documentation, and knowledge transfer practices.
In these cases, the DMAIC framework applies directly: define the cyclical pattern as the problem, measure its magnitude and period, analyze the root cause, improve the process to reduce or remove the cycle, and control to ensure the improvement holds.
Remove Cyclical Effects Before Assessing Baseline Capability
One of the most practically important applications of cyclical variation analysis in Six Sigma is proper baseline establishment. If a process is subject to strong cyclical variation and you collect your baseline data during only the high or low phase of the cycle, your capability analysis will be misleading.
Process capability indices (Cp, Cpk, Ppk) should be calculated on data that represents the full range of normal operating conditions — including the cyclical variation the process experiences. Data collected only during a favorable phase of a cycle will produce an optimistic capability estimate that does not reflect how the process actually performs over time.
When planning data collection for a Six Sigma project, always ask: is there a known cyclical pattern in this process, and does my data collection window span enough of the cycle to represent normal conditions?
Also Read: How to Master Process Variation for Better Product Quality?
Cyclical Variation and the Control Phase
In the Control phase of DMAIC, monitoring plans need to account for known cyclical patterns. A control chart that appears stable during the favorable phase of a cycle may show apparent out-of-control signals during the unfavorable phase — not because the process has changed, but because the cycle has turned.
Teams that have identified cyclical variation in the Measure or Analyze phase should document it in the control plan, so that operators and quality engineers can distinguish between:
- A true process shift requiring immediate investigation
- A known cyclical pattern that has been accounted for and is being managed proactively
This distinction prevents both under-reaction (ignoring a real shift because “it always does this”) and over-reaction (launching a full investigation into behavior that is a predictable feature of a documented cycle).
Learn to Analyze Process Variation in Our Training Programs
Identifying and correctly classifying variation — common cause, special cause, seasonal, cyclical — is one of the most important skills in Lean Six Sigma. The ability to look at a control chart or time series plot and recognize what type of variation is present determines whether your improvement efforts are aimed at the right problem.
At Six Sigma Development Solutions, variation analysis is taught as a core skill in our Green Belt and Black Belt programs — with real data examples, software exercises, and the practical judgment that comes from applying these concepts in actual process improvement work:
- Onsite training at your facility, using your processes and your data
- Live virtual classroom with a live instructor, real-time Q&A, and structured project work
- Online self-paced certification you can complete on your own schedule
Our Green Belt program covers control charts, time series interpretation, multi-vari analysis, and the full DMAIC toolset for identifying and reducing all types of process variation. Our Black Belt program adds advanced time series methods, regression-based variation analysis, and design of experiments.
About Six Sigma Development Solutions, Inc.
Six Sigma Development Solutions, Inc. offers onsite, public, and virtual Lean Six Sigma certification training. We are an Accredited Training Organization by the IASSC (International Association of Six Sigma Certification). We offer Lean Six Sigma Green Belt, Black Belt, and Yellow Belt, as well as LEAN certifications.
Book a Call and Let us know how we can help meet your training needs.


