
A FAST Diagram helps teams break down complex systems into clear, manageable functions. To be honest, most project delays happen because people don’t agree on what a product is actually supposed to do. Have you ever sat in a meeting where everyone had a different idea of the “main goal”?
We’ve all been there, and it’s frustrating. That is where the Function Analysis System Technique (FAST) comes in to save your time and budget.
Table of contents
What is a FAST Diagram?
The Function Analysis System Technique, or FAST, is a visual tool used in value engineering. It doesn’t just show how a product is built; it shows why each part exists. Think of it as a map of logic. It organizes functions into a clear hierarchy. This allows your team to see the relationship between what a system does and the goals it needs to reach.
Created by Charles Bytheway in 1964, this method has become a staple for engineers and project managers. It moves the conversation away from “parts and pieces” and toward “functions and results.” Why does this matter? Because when you focus on functions, you find better ways to innovate without losing quality.

Public, Onsite, Virtual, and Online Six Sigma Certification Training!
- We are accredited by the IASSC.
- Live Public Training at 52 Sites.
- Live Virtual Training.
- Onsite Training (at your organization).
- Interactive Online (self-paced) training,
The Logic Behind Function Analysis
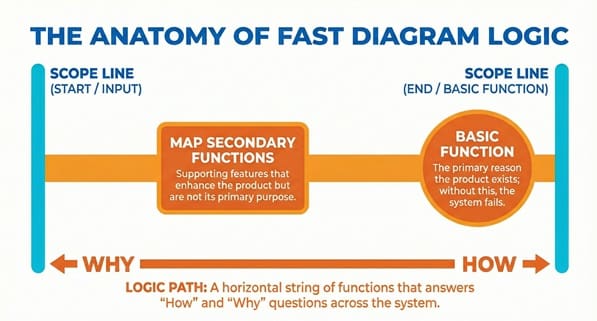
At its heart, the FAST Diagram relies on a very simple logic check: the “How-Why” questions. This is the “secret sauce” of the whole process. If you move from left to right across the diagram, you are asking “How” a function is performed. If you move from right to left, you are asking “Why” that function is necessary.
Does the logic hold up both ways? If it does, you have a solid diagram. If it doesn’t, you likely missed a step or a hidden function. It’s like a puzzle where every piece must support the one next to it. In my experience, this logic check is the best way to catch errors before you spend a dime on manufacturing or software coding.
Why Should You Use This Technique?
You might wonder, “Is this just more paperwork?” Actually, it’s the opposite. It clears the clutter. Here is why we think every project lead should use it:
- Team Consensus: It gets everyone on the same page. No more “I thought we were doing X.”
- Identifying Waste: You will quickly see functions that don’t contribute to the main goal. These are your cost-saving opportunities.
- Better Creativity: By defining a function (like “provide light”) instead of a part (like “lightbulb”), you open the door to new solutions (like LEDs or fiber optics).
- Clear Communication: It’s a bridge between technical teams and stakeholders.
Also Read: Matrix Diagram
Key Components of a FAST Diagram
To build a proper chart, you need to understand the different types of functions. We don’t just lump everything together. We categorize them to understand their value.
1. The Scope Lines
Everything happens within two vertical lines. The left line is the “Basic Function” or the reason the project exists. The right line represents the “Input” or the trigger that starts the process.
2. Basic Functions
This is the primary reason for the product’s existence. For a chair, the basic function is “support weight.” If a chair doesn’t do that, it fails.
3. Secondary Functions
These support the basic function. For our chair example, a secondary function might be “provide comfort” or “enhance decor.” While these are nice, they are not the primary reason someone buys a chair to sit on.
4. Logic Path
This is the horizontal string of functions that answers the How-Why questions. It represents the “critical path” of the system’s logic.
How to Create a FAST Diagram Step-by-Step
Ready to build one? Grab a stack of sticky notes and a large whiteboard. It is much easier to do this as a group activity.
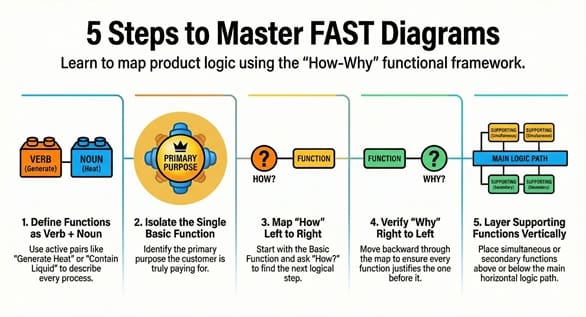
Step 1: Identify the Functions
List every single thing the product or process does. Use an “Active Verb + Measurable Noun” format. For example, “generate heat” or “contain liquid.” Avoid vague words. Roughly 10 to 20 functions are usually enough for a standard project.
Step 2: Determine the Basic Function
From your list, pick the one thing the customer is truly paying for. Ask yourself: “If I take this away, does the product still serve its purpose?”
Step 3: Arrange the Logic Path
Place your Basic Function on the far left (inside the scope line). Now, ask: “How do we do this?” The answer becomes the next function to the right. Keep going until you hit the “Input” on the right side.
Step 4: Verify with “Why”
Now, go backward. Start from the right and ask “Why do we do this?” The function to its left should be the answer. If the logic breaks, you need to rethink your labels.
Step 5: Add Supporting Functions
Not every function fits on the main horizontal line. Some happen at the same time (All-the-time functions) or are caused by others. Place these above or below the main path.
Real-World Example: A Simple Flashlight
Let’s look at a flashlight through the lens of a FAST Diagram.
- Higher Order Purpose: Provide illumination.
- Basic Function: Emit light.
- How? By converting electricity.
- How? By closing a circuit.
- How? By moving a switch.
Now, let’s go backward. Why do we move a switch? To close a circuit. Why do we close a circuit? To convert electricity. Why do we convert electricity? To emit light. It works!
Now, where does “protect components” (the plastic case) go? That’s a secondary function. It would sit below the main line because it supports the process but isn’t the primary logic for emitting light.
Common Mistakes to Avoid
In my view, the biggest mistake is using too many words. Keep it to two words whenever you can. “Hold water” is better than “It acts as a container to hold the water for the user.”
Another pitfall is “feature creep.” Don’t list features (like “blue color”). List the function (like “attract buyer”). If you focus on the “what” instead of the “how,” you’ll find that your FAST Diagram becomes a powerful tool for innovation rather than just a boring chart.
FAST vs. Traditional Flowcharts
It’s easy to confuse these. A flowchart shows a sequence of events in time—first this happens, then that. A FAST Diagram shows a sequence of logic. Time doesn’t matter here. What matters is the relationship between the “why” and the “how.”
| Feature | Flowchart | FAST Diagram |
| Focus | Sequence/Process | Function/Logic |
| Logic | “What happens next?” | “How is this done?” |
| Goal | Show workflow | Show value and purpose |
Also Read: What Is an Activity Network Diagram?
Key Takeaways
- The FAST Diagram is a logic-based map used in value engineering.
- It uses a “How-Why” logic to verify the relationship between functions.
- Functions are always written as an Active Verb + Noun.
- It helps teams identify unnecessary costs and spark creative solutions.
- The Basic Function is the core reason for the project’s existence.
Frequently Asked Questions
What does FAST stand for in project management?
It stands for Function Analysis System Technique. It is a core part of Value Engineering.
Who should be involved in creating a FAST Diagram?
Ideally, a cross-functional team. This includes engineers, designers, marketers, and even end-users. Diverse perspectives help uncover hidden functions.
How many functions should a diagram have?
There is no set number, but keep it simple. If it gets too messy, you might be looking at a system that is too complex. You can always create “sub-diagrams” for specific parts.
Can I use this for software development?
Yes! It’s great for defining user stories and ensuring that every line of code serves a functional purpose for the user.
Final Words
The FAST Diagram is more than just a technical drawing; it is a way to see the “soul” of your project. By stripping away the fluff and focusing on core functions, you empower your team to build better, cheaper, and more effective solutions. At our company, we believe that clarity is the first step toward excellence.
We are dedicated to helping our clients find the most efficient paths to success by focusing on what truly matters. We value your time and your vision, and we’re here to help you map it out perfectly.


