
In statistical analysis, hypothesis testing plays a critical role in making data-driven decisions. The process typically involves testing two mutually exclusive hypotheses: the null hypothesis (H0) and the alternative hypothesis (H1). This distinction helps researchers test assumptions or claims about population parameters and make informed conclusions based on sample data.
H1 is central to hypothesis testing, as it represents the claim or assumption that the researcher aims to support. In contrast, the null hypothesis (H0) generally represents a status quo or a claim of no effect, no difference, or no relationship.
This article explores the concept of the alternative hypothesis, how it fits into the framework of hypothesis testing, and its role in statistical decision-making.
Table of contents
What Is the Alternative Hypothesis?
In the context of hypothesis testing, an alternative hypothesis is the hypothesis that contradicts the null hypothesis. It suggests that a specific effect, difference, or relationship exists in the population or that a population parameter has changed. Essentially, it is the hypothesis that a researcher aims to prove through statistical evidence.
It is the statement researchers aim to support through data analysis. Denoted as H₁ or Hₐ, this hypothesis represents a claim that contradicts the null hypothesis. It is used when we want to prove that a particular effect, relationship, or difference exists in a population. It is often the statement that researchers hope to accept as true, depending on the data they collect.
H1 can take several forms depending on the type of test being conducted:
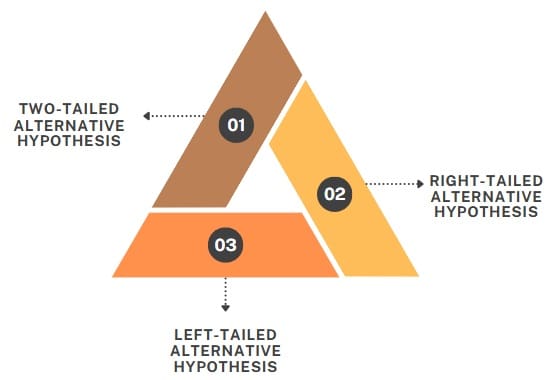
- Two-tailed alternative hypothesis: This hypothesis suggests that a population parameter is not equal to a specified value (i.e., it could be either greater than or less than the value). For example, H1: µ ≠ 2010.
- Right-tailed alternative hypothesis: In this case, the hypothesis suggests that the population parameter is greater than a specified value. For example, H1: µ > 900.
- Left-tailed alternative hypothesis: Here, the hypothesis suggests that the population parameter is less than a specified value. For example, H1: p < 0.02.
What Does the Alternative Hypothesis Represent?
The alternative hypothesis is an assertion that there is a difference, relationship, or effect present. It could suggest that a population mean is not equal to a specific value, or that two groups differ significantly in some way. For example, a researcher might believe that a new drug works better than an existing one.
It would then be that the new drug leads to a greater improvement in patients than the current treatment.
Relationship Between the Null and Alternative Hypothesis
The null hypothesis, often denoted as H₀, is the hypothesis that researchers generally seek to reject. It assumes that there is no significant difference or effect. In contrast, the alternative hypothesis represents all the possible outcomes that could occur if the null hypothesis is false. In other words, if there is enough evidence to reject H₀, we accept H₁.
To clarify, the conclusion of a hypothesis test is always stated in terms of the null hypothesis. We either:
- Reject H₀ in favor of H₁ (accept the alternative hypothesis).
- Fail to reject H₀ (meaning there is insufficient evidence to support H₁).
It is important to note that even when we fail to reject the null hypothesis, we do not claim that H₀ is true. Instead, we simply state that there isn’t enough evidence to support H₁.
Example
Let’s take an example to understand the relationship between the null and alternative hypothesis:
- H₀ (null hypothesis): There is no difference between the number of males and females visiting the cinema.
- H₁ (alternative hypothesis): Males visit the cinema more often than females.
In this case, the null hypothesis assumes that gender does not affect cinema visits. The alternative hypothesis suggests that males go to the cinema more than females.
To test this, data would be collected to assess the frequency of cinema visits by both genders. If the data show a significant difference, the null hypothesis would be rejected in favor of the alternative hypothesis.
Formulating an Alternative Hypothesis
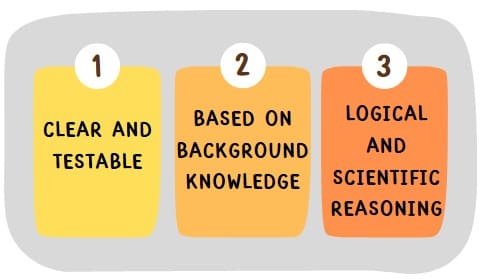
When formulating an alternative hypothesis, it is important to remember the following guidelines:
- The hypothesis should be clear and testable: It should state what the researcher expects to prove, and the language used must be precise.
- It must be based on background knowledge: A solid understanding of the subject matter is crucial. A researcher needs to have a thorough knowledge of what has already been discovered in the field and must be aware of existing theories and findings.
- Use logical and scientific reasoning: Formulating a hypothesis requires the ability to apply logical thinking and scientific methods. Researchers should be well-versed in scientific approaches to create meaningful hypotheses.
Role of the Alternative Hypothesis in Testing
The alternative hypothesis is central to the process of hypothesis testing. It represents what the researcher believes might be true, or what they hope to prove, based on the evidence provided by the sample data.
Hypothesis testing seeks to gather enough evidence to either reject the null hypothesis in favor of the alternative hypothesis or fail to reject the null hypothesis due to insufficient evidence.
Key Differences Between the Null and Alternative Hypotheses
The null hypothesis (H0) and the alternative hypothesis (H1) are two complementary statements in the testing process. Their key differences are:
| Aspect | Null Hypothesis (H₀) | Alternative Hypothesis (H₁) |
| Nature | Represents no effect, no difference, or no relationship. It is the baseline assumption. | Represents the claim that there is an effect, a difference, or a relationship. |
| Mathematical Symbols | Often contains an equality sign (e.g., µ = 2010, p = 0.5). | Does not contain an equality sign and may use inequality symbols (e.g., µ ≠ 2010, p < 0.5, µ > 900). |
| Objective | The goal is to test if there is sufficient evidence to reject H₀. | The goal is to test if there is sufficient evidence to support H₁. |
| Evidence | H₀ is assumed true until proven otherwise. | H₁ is the hypothesis being tested and supported if sufficient evidence is found. |
Examples
Let’s consider some practical examples to illustrate the application of the alternative hypothesis in different contexts:
Example 1: Cable Strength Test
Suppose a shipment of cables is claimed to meet a specific breaking strength of 2010 pounds. A random sample of 32 cables has a mean breaking strength of 1895 pounds with a standard deviation of 59 pounds. The goal is to determine if there is a significant difference from the claimed strength.
- Null Hypothesis (H0): µ = 2010 pounds (no difference)
- Alternative Hypothesis (H1): µ ≠ 2010 pounds (there is a difference)
In this case, we are testing if the mean breaking strength of the cables is different from 2010 pounds.
Example 2: Light Bulb Lifetime Test
A company claims that its light bulbs last more than 900 hours on average. A sample of 300 bulbs has an average lifetime of 884 hours. The company wants to know if it can claim that the average lifetime is greater than 900 hours.
- Null Hypothesis (H0): µ = 900 hours
- Alternative Hypothesis (H1): µ > 900 hours
Here, the alternative hypothesis suggests that the average lifetime is greater than 900 hours.
Example 3: Proportion of Men Watching Football
An NFL report claims that the proportion of men watching Monday Night Football games is 50%. A random sample of 500 viewers shows that 238 are men. The goal is to test if the report is false.
- Null Hypothesis (H0): p = 0.5 (50% of viewers are men)
- Alternative Hypothesis (H1): p ≠ 0.5 (the proportion is not equal to 50%)
This hypothesis test evaluates whether the proportion of men differs from 50%.
Example 4: Defective Parts in Manufacturing
An electrical company claims that less than 2% of its parts are defective. A sample of 642 parts reveals that 17 are defective. The goal is to determine if the company’s claim holds.
- Null Hypothesis (H0): p = 0.02 (2% of parts are defective)
- Alternative Hypothesis (H1): p < 0.02 (fewer than 2% of parts are defective)
Here, the alternative hypothesis tests if the proportion of defective parts is lower than 2%.
Simple vs. Composite Hypothesis
In hypothesis testing, hypotheses can be classified as simple or composite. A simple hypothesis specifies the population or distribution completely, while a composite hypothesis does not.
- Simple hypothesis: Specifies exact values for population parameters (e.g., H0: µ = 25).
- Composite hypothesis: Includes a range of possible values for population parameters (e.g., H1: µ ≠ 25, where µ can be any value other than 25).
Type I and Type II Errors
In hypothesis testing, there are two types of errors that can occur:
- Type I error: Occurs when the null hypothesis is rejected when it is actually true. This is also called a “false positive.”
o α is the probability of making a Type I error. - Type II error: Occurs when the null hypothesis is not rejected when the alternative hypothesis is true. This is called a “false negative.”
o β is the probability of making a Type II error.
A good test minimizes both Type I and Type II errors. However, reducing one type of error often increases the other, so a balance must be struck.
Testing Procedures and Test Statistics
Once the null and alternative hypotheses are set, the next step is to design a test procedure. The test statistic is a function of the observed data that helps determine whether the null hypothesis can be rejected. The following steps outline the typical process:
- Set up the null and alternative hypotheses.
- Design a test statistic that summarizes the data and has good properties.
- Find the distribution of the test statistic under the null hypothesis.
- Identify the critical region where rejection of the null hypothesis is warranted.
- Calculate the test statistic using observed data.
- Check if the test statistic falls into the critical region.
If the test statistic falls within the critical region, the null hypothesis is rejected in favor of the alternative hypothesis.
Final Words
The alternative hypothesis plays a critical role in hypothesis testing, representing the claim that a researcher seeks to prove with statistical evidence. Whether testing for differences in means, proportions, or relationships, the alternative hypothesis provides the foundation for making decisions based on sample data.
Researchers use the alternative hypothesis to test assumptions about populations, evaluate claims, and assess the likelihood of a particular outcome. By understanding how to frame and test alternative hypotheses, researchers can make more informed and statistically valid conclusions.


