

Factor analysis is a statistical method that explores the underlying structure of a set of variables. It reduces large datasets into smaller, more manageable factors. This technique allows researchers and analysts to uncover latent relationships between observed variables, simplifying complex data structures and making it easier to interpret.
The primary goal of factor analysis is to identify patterns of correlations among variables and group them into fewer underlying factors, often referred to as “latent variables.”
In this guide, we’ll delve into the purpose, methods, assumptions, applications, and other aspects of factor analysis, providing a clear understanding of how it works and its uses in various fields.
Table of contents
What is Factor Analysis?
Factor analysis is a statistical technique to analyze and reduce data complexity. It identifies latent variables, also known as factors. These factors represent underlying constructs that explain the correlations observed in a large set of variables. Factor analysis helps summarise information, detect patterns, and reduce redundancy among variables.
For example, In psychological research, you may find that multiple test items measuring different aspects of personality are correlated. Factor analysis can identify the latent factors (such as extraversion or conscientiousness) that explain the correlations between the test items, effectively reducing the complexity of the data and aiding in the interpretation.
Purposes of Factor Analysis
Factor analysis serves several important purposes across various fields, such as psychology, economics, marketing, and social sciences. Below are the main uses of factor analysis:
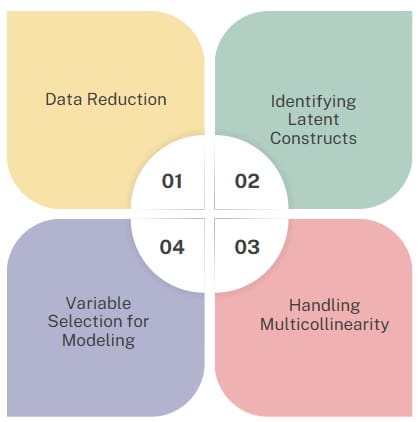
- Data Reduction
Factor analysis often reduces the number of variables in a dataset by combining them into a smaller number of factors. This is particularly useful in situations where the original dataset contains many correlated variables, and modeling all of them would be too complex or inefficient.
For instance, in survey data with numerous questions, factor analysis can group related questions into broader categories (factors), making it easier to analyze and interpret the data. - Identifying Latent Constructs
Another key purpose of factor analysis is to uncover latent variables, or unobserved constructs, that drive correlations among a set of observed variables. Researchers often treat these latent factors as theoretical constructs that cannot be directly measured but influence multiple observed variables.
For example, in marketing research, an underlying factor like “brand perception” influences multiple observed variables (e.g., customer satisfaction, product quality, price sensitivity). - Handling Multicollinearity
Factor analysis addresses issues of multicollinearity in regression models by creating a set of uncorrelated factors.
When you include highly correlated predictor variables in a regression model, they create instability and bias in parameter estimates. Factor analysis reduces the dimensionality of the data and generates uncorrelated factors, which regression models use to avoid multicollinearity. - Variable Selection for Modeling
Factor analysis selects a subset of variables that are most strongly correlated with the principal factors. This technique proves particularly useful in structural equation modeling (SEM), where reducing the number of variables ensures a more manageable and interpretable model.
How Does Factor Analysis Work?
Factor analysis begins with a set of variables that are highly correlated with one another. You then group these variables together based on their relationships, with the goal of identifying a small number of factors that can explain the observed correlations.
To illustrate this concept, imagine you have a set of variables, such as test scores, that are related to each other. Factor analysis will group these related variables into one factor.
If some variables do not correlate with others, they are considered separate, orthogonal factors. The ideal outcome of factor analysis is the identification of factors that are independent of each other.
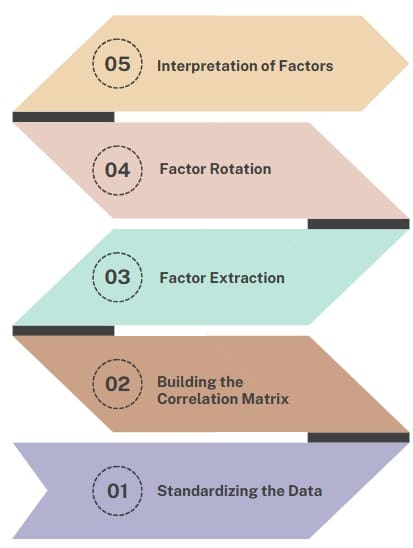
The process of factor analysis usually involves several steps, such as:
- Standardizing the Data: You often standardize the data, ensuring that all variables contribute equally to the analysis.
- Building the Correlation Matrix: The next step is to calculate the correlation matrix, which shows the relationships between all variables.
- Factor Extraction: You extract the factors from the correlation matrix using different techniques, such as principal component analysis or principal axis factoring. The goal is to find the number of factors that best explain the observed correlations among variables.
- Factor Rotation: After extraction, the factors are rotated to achieve a clearer and simpler structure. This step helps to make the factors more interpretable.
- Interpretation of Factors: You interpret the factors by examining the factor loadings, which indicate how strongly each variable contributes to a factor.
Assumptions of Factor Analysis
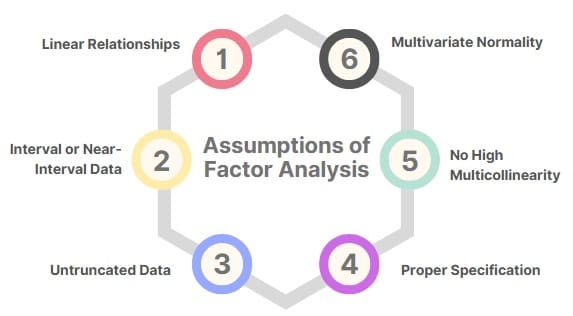
Factor analysis is part of the broader family of Multiple General Linear Hypothesis (MGLH) procedures and shares many assumptions with multiple regression. These assumptions are necessary to ensure the validity of the results obtained from factor analysis:
- Linear Relationships: The relationships between the observed variables and factors are assumed to be linear.
- Interval or Near-Interval Data: Factor analysis assumes that the data is interval or ratio scale, or at least close to this scale.
- Untruncated Data: The data should not have any extreme values or truncation that could skew the analysis.
- Proper Specification: The model should include relevant variables and exclude extraneous ones that do not contribute to the factor structure.
- No High Multicollinearity: There should be no high correlations between the independent variables to avoid redundancy.
- Multivariate Normality: The data should follow a multivariate normal distribution for valid significance testing.
Add link here: Lean Six Sigma Certification Programs, Baton Rouge, Louisiana
Steps in Conducting Exploratory Factor Analysis (EFA)
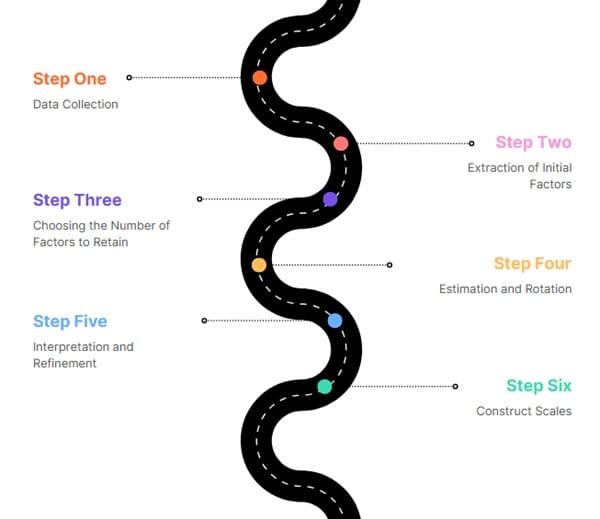
Researchers typically use Exploratory Factor Analysis (EFA) when they have no prior hypothesis about the factor structure. The process of EFA involves several key steps:
Data Collection
The first step is to collect the relevant data. You select a set of variables that you hypothesize to be related, and these variables will serve as the input for the factor analysis.
Extraction of Initial Factors
The next step involves extracting the initial factors from the data. Researchers commonly use the Principal Component Analysis (PCA) method to do this. PCA helps to identify the factors that account for the largest variance in the data.
Choosing the Number of Factors to Retain
A critical decision in factor analysis is determining how many factors to retain. You can use several criteria, such as examining the eigenvalues (values greater than 1). The Scree Plot method helps visualize the point at which additional factors contribute little to the overall variance.
Estimation and Rotation
After deciding on the number of factors to retain, the next step is to estimate the factor model and then rotate the factors for easier interpretation. You perform factor rotation to simplify the factor loadings and make the structure more interpretable. There are two main types of rotation:
- Orthogonal Rotation (Variance Rotation): This keeps factors uncorrelated.
- Oblique Rotation (Promax Rotation): This allows factors to correlate, which is often more realistic in social sciences.
Interpretation and Refinement
After the rotation, the factors are interpreted based on the factor loadings. These loadings represent the correlation between the observed variables and the factors. The analysis groups variables that load highly on the same factor together. The researcher then infers the meaning of the factor based on these associations.
Construct Scales
After interpreting the factors, you can construct scales based on the factor loadings. For more detailed modelling, you can then use these scales in subsequent analysis, such as regression or SEM.
Factor Extraction Methods
Factor extraction involves identifying the factors that best represent the correlations among the variables. There are several methods used to extract factors, including:
- Centroid Method (Thurstone, 1947): This method uses the correlation matrix and calculates the factor loadings by finding the “centroid” (the center) of the matrix. This method is one of the oldest and simplest approaches.
- Principal Axes Method (Kelley, 1935): This method seeks to find the underlying structure of the correlation matrix by using the method of least squares. It is often used in social sciences.
- Principal Components Method (Hotelling, 1933): This is the most commonly used method in factor analysis. It transforms the original variables into new, uncorrelated variables called principal components. You rank these components based on the amount of variance they explain in the data.
Methods of Factor Analysis
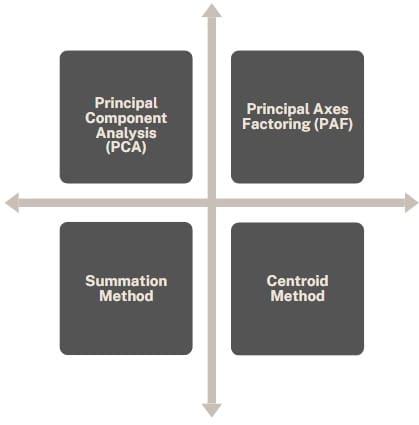
There are different methods to perform factor analysis, each with its own strengths and applications. The primary methods include:
- Principal Component Analysis (PCA)
PCA is the most commonly used method of factor extraction. It involves selecting factors that explain the maximum variance in the data. The first factor represents the most highly correlated variables, and each subsequent factor explains less variance. PCA is often used for data reduction. - Principal Axes Factoring (PAF)
This method is used to extract factors by maximizing the common variance. Unlike PCA, which focuses on the total variance, PAF focuses on the shared variance among variables. - Centroid Method
The method calculates the factor loadings by considering the correlation between variables and their factors. The centroid method adjusts the factor loadings iteratively until it finds a satisfactory solution. - Summation Method
This method relies on the idea that the sum of the variables’ correlations forms the factor structure. Researchers use it less commonly compared to PCA or PAF.
Key Concepts in Factor Analysis
To fully understand factor analysis, it’s important to familiarize yourself with several key concepts:
Factor Loadings:
Factor loadings represent the relationship between observed variables and the underlying factors. A higher factor loading indicates that a variable is strongly related to a particular factor. Factor loadings help in interpreting the meaning of each factor, as they show which variables contribute most to each factor.
Eigenvalues and Eigenvectors:
In factor analysis, eigenvalues represent the amount of variance explained by a particular factor. You compute the eigenvalue from the correlation matrix of the variables, and it determines the importance of a factor. Eigenvectors, on the other hand, represent the direction of the factor in a multi-dimensional space.
Communalities:
You use communalities to indicate how much of the variance in an observed variable is explained by the factors. A high communality value means that the factor analysis model does a good job of explaining the variance in that variable.
Variance Explained:
This refers to the proportion of the total variance in the observed variables that the factors account for. The more variance explained by the factors, the better the model fits the data.
Methods for Determining the Number of Factors
Deciding how many factors to retain is one of the most challenging aspects of factor analysis. Several methods can help in this decision:
- Eigenvalue Criterion: You typically retain factors with eigenvalues greater than 1, as they explain more variance than a single observed variable.
- Scree Plot: A visual method that plots the eigenvalues of the factors. The point where the plot flattens is usually where you should stop extracting factors.
- Cattell’s Scree Test: Based on the shape of the plot, the researcher can visually assess where the number of meaningful factors ends.
- Parallel Analysis: Compares the eigenvalues obtained from the data with those obtained from randomly generated data. Only factors with eigenvalues greater than the random values are retained.
Advantages of Factor Analysis
Data Reduction: Factor analysis allows for the reduction of a large number of variables into fewer factors, making the data more manageable and interpretable.
Uncover Hidden Patterns: Factor analysis can reveal underlying relationships and structures in data that are not immediately apparent.
Flexibility: You can use the method with both objective and subjective data, and it helps identify both observable and latent factors.
Disadvantages of Factor Analysis
Subjectivity: The interpretation of factors can be subjective and depend on the researcher’s theoretical understanding of the data.
Assumptions: Factor analysis makes several assumptions, such as linearity and multivariate normality, which may not always hold true in real-world data.
Complexity: Determining the appropriate number of factors and interpreting the results can be complex and time-consuming.
Applications of Factor Analysis
Factor analysis is widely used in various fields for multiple purposes:
- Identifying underlying factors: Factor analysis can identify patterns in data that are not immediately apparent. For example, it can reveal clusters of variables that you find highly correlated and likely represent a single underlying factor.
- Reducing the number of variables: By summarizing a large set of variables into a smaller set of factors, factor analysis makes the data easier to interpret and analyze.
- Handling multicollinearity: In regression analysis, multicollinearity occurs when independent variables highly correlate with each other. Factor analysis creates a set of uncorrelated factors, which you can use in regression models to address multicollinearity.
- Validating scales and indices: Factor analysis confirms that the items in a scale or index measure the same underlying construct. Factor rotation helps identify problematic items that you may find poorly correlated with the intended factor.
- Clustering objects or cases: Factor analysis can help identify groups or clusters within the data. This is useful in segmentation, where you may want to group individuals with similar behaviors or attributes.
Final Words
Factor analysis uncovers the hidden structure in a large set of variables, reduces data complexity, and identifies latent factors that drive observed relationships. It is a powerful statistical technique used for these purposes. While it has numerous applications in research and industry, it also requires careful consideration of assumptions, model choice, and interpretation of results.
By following the correct methodology and understanding the key concepts, factor analysis can provide valuable insights into complex datasets and enable researchers to develop more efficient models for further analysis.

About Six Sigma Development Solutions, Inc.
Six Sigma Development Solutions, Inc. offers onsite, public, and virtual Lean Six Sigma certification training. We are an Accredited Training Organization by the IASSC (International Association of Six Sigma Certification). We offer Lean Six Sigma Green Belt, Black Belt, and Yellow Belt, as well as LEAN certifications.
Book a Call and Let us know how we can help meet your training needs.


