Table of Contents
What is Sales Process Mapping and How to Do It?
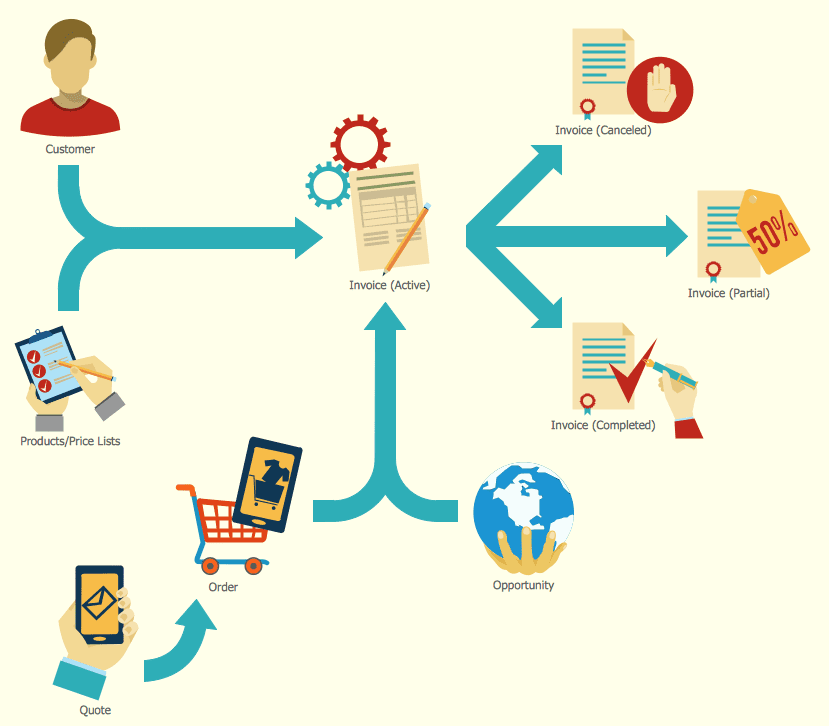
Sales process mapping is a visual representation or diagram that outlines the various stages, steps, and activities involved in a company’s sales process. It provides a clear and structured view of how a sale progresses from the initial lead generation to closing the deal. This mapping is typically done using flowcharts, diagrams, or other visual tools to make it easy for sales teams to understand and follow the process. At the end of this article are some process mapping examples for your review.
Here’s how it works and its application to continuous improvement:
- Understanding the Current Process: The first step in sales process mapping is to thoroughly understand the existing sales process. This involves gathering input from various stakeholders, including salespeople, managers, and sometimes customers. The goal is to document each step of the process, including who is responsible for each task, what tools or resources are used, and what the key milestones are.
- Visual Representation: Once you have a clear understanding of the process, it’s time to create a visual representation. Flowcharts, swimlane diagrams, or other visual tools are used to create a clear and concise map of the sales process. This visual representation makes it easier to identify bottlenecks, redundancies, or inefficiencies in the process.
- Analysis and Evaluation: With the sales process mapped out, you can now analyze it for strengths and weaknesses. This involves looking for areas where salespeople might encounter challenges, where leads might get stuck or lost, and where there may be opportunities for improvement. Metrics and data can also be integrated into the mapping to measure the performance of each stage.
- Continuous Improvement: Sales process mapping is a critical tool for continuous improvement in sales operations. It helps in several ways:
- Identifying Inefficiencies: By visualizing the process, you can easily spot bottlenecks, redundant steps, or areas where salespeople may face difficulties. This allows you to target specific areas for improvement.
- Standardization: Mapping helps standardize the sales process across the organization, ensuring that all team members follow the same steps and best practices.
- Data-Driven Decision-Making: Integrating data into your map allows you to track key performance indicators (KPIs) at each stage of the process. This data can be used to make informed decisions and adjustments to improve sales performance.
- Training and Onboarding: Sales process mapping is a valuable tool for training new sales team members. They can use the map as a guide to understand how sales are conducted within the organization.
- Iterative Process: Continuous improvement is an ongoing effort. As you implement changes based on your sales process mapping, you should continue to monitor and evaluate the impact of those changes. If new issues arise or if there are further opportunities for improvement, the process map can be updated accordingly.
In summary, sales process mapping is a method for visually representing and analyzing the sales process, with the goal of identifying areas for improvement and optimizing sales operations. It is a valuable tool for achieving continuous improvement in sales by fostering standardization, data-driven decision-making, and ongoing refinement of processes.

How do you create a Sales Process Flowchart?
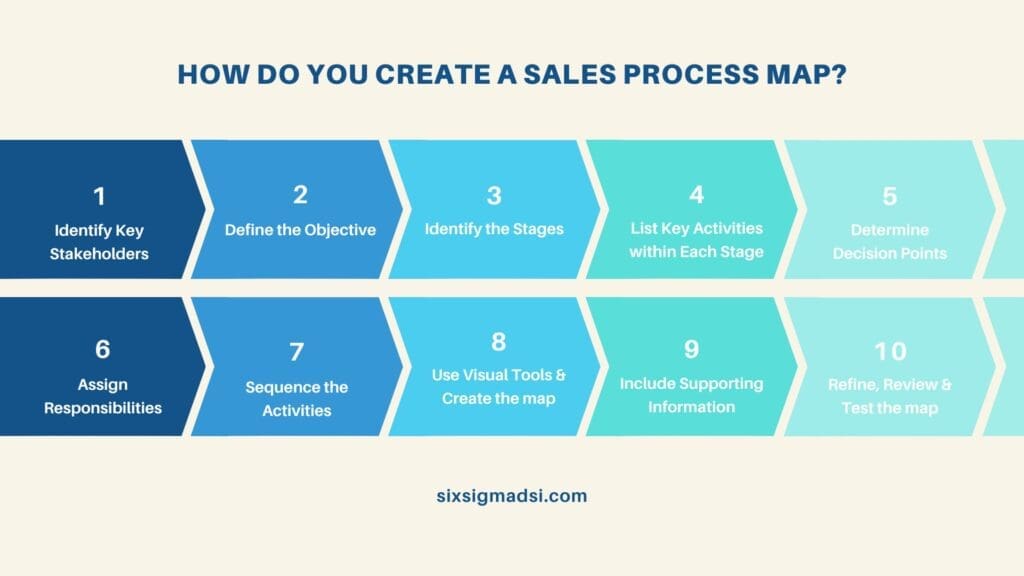
Creating a sales process flowchart involves several steps to document and visualize the various stages, steps, and activities involved in your sales process. Here’s a step-by-step guide:
- Identify Key Stakeholders:
- Gather a cross-functional team that includes sales representatives, managers, marketing professionals, and any other relevant stakeholders. Their input and expertise will be valuable in accurately mapping the sales process.
- Clearly Define the Objective:
- What do you want to achieve with this visual representation? For example, it could be to improve efficiency, standardize procedures, or identify bottlenecks.
- Identify the Stages:
- Break down the sales process into distinct stages. Typically, these stages include lead generation, qualification, needs analysis, presentation, objection handling, closing, and post-sale activities. The specific stages may vary based on your industry and organization.
- List Key Activities within Each Stage:
- For each stage, list the key activities or tasks that need to be completed. These activities should be sequential and represent what a salesperson typically does during that stage. Include activities related to communication, documentation, and decision-making.
- Determine Decision Points:
- Identify decision points within the process where certain actions or conditions trigger a transition to the next stage or a different path. Decision points might involve lead scoring, qualification criteria, or customer responses.
- Assign Responsibilities:
- Specify who is responsible for each activity or task within each stage. This helps clarify roles and accountabilities within the sales process.
- Sequence the Activities:
- Arrange the activities in a logical sequence within each stage. This helps ensure that the process flows smoothly and naturally.
- Use Visual Tools:
- Choose a visual tool or software to create your sales process map. Common tools include flowchart software like Microsoft Visio, Lucidchart, draw.io, or even simple tools like Microsoft PowerPoint or Google Slides.
- Create the Map:
- Begin creating the sales process map using your chosen visual tool. Use shapes, lines, and connectors to represent stages, activities, and decision points. Label each element clearly and concisely.
- Include Supporting Information:
- You may want to include additional information, such as relevant data points, KPIs, or metrics at various stages. This can help in monitoring and measuring the performance of your sales process.
- Review and Refine:
- Share the initial draft of the sales process map with your team for feedback. Ensure that the map accurately represents the current process and is easy to understand.
- Test the Map:
- Put the sales process map to the test by applying it to real-world scenarios. This will help identify any gaps or inaccuracies in the map.
- Iterate and Update:
- Sales processes are not static; they evolve over time. Regularly review and update the sales process map to reflect any changes, improvements, or new insights.
- Training and Implementation:
- Use the finalized map as a training tool for new sales team members. Ensure that everyone in your organization understands and follows the mapped process.
- Continuous Improvement:
- As mentioned earlier, use the sales process map as a basis for continuous improvement efforts. Analyze performance data, gather feedback, and make adjustments as needed to optimize your sales process.
Creating a sales process map is an ongoing process that requires collaboration, careful documentation, and a commitment to improving sales efficiency and effectiveness over time.

What are some examples?
Sales process mapping can vary widely from one organization to another, as it is tailored to the specific needs and objectives of each business. Here are some examples of common sales process maps that can serve as templates or inspiration for your own organization:
- Simple Sales Process Map Example:
- Stage 1: Lead Generation
- Activity 1: Inbound Marketing
- Activity 2: Outbound Prospecting
- Stage 2: Qualification
- Activity 1: Lead Scoring
- Activity 2: Initial Contact
- Stage 3: Needs Analysis
- Activity 1: Discovery Meetings
- Activity 2: Customer Questionnaires
- Stage 4: Presentation
- Activity 1: Product Demos
- Activity 2: Proposal Submission
- Stage 5: Objection Handling
- Activity 1: Addressing Concerns
- Activity 2: Negotiation
- Stage 6: Closing
- Activity 1: Contract Signing
- Activity 2: Payment Processing
- Stage 7: Post-Sale
- Activity 1: Onboarding
- Activity 2: Customer Support
- Stage 1: Lead Generation
- B2B Complex Sales Process Map Example:
- Stage 1: Lead Generation
- Activity 1: Content Marketing
- Activity 2: Events and Webinars
- Stage 2: Lead Qualification
- Activity 1: Lead Scoring
- Activity 2: Initial Outreach
- Stage 3: Needs Assessment
- Activity 1: Discovery Calls
- Activity 2: Needs Analysis Workshops
- Stage 4: Solution Design
- Activity 1: Solution Proposals
- Activity 2: Technical Assessments
- Stage 5: Evaluation and Negotiation
- Activity 1: Product Testing
- Activity 2: Pricing Negotiations
- Stage 6: Closing and Contracting
- Activity 1: Contract Negotiation
- Activity 2: Legal Review
- Stage 7: Implementation and Onboarding
- Activity 1: Project Kickoff
- Activity 2: Training
- Stage 8: Post-Sale Relationship
- Activity 1: Account Management
- Activity 2: Ongoing Support
- Stage 1: Lead Generation
These are just a few examples of sales process maps. Depending on your industry, organization size, and specific sales goals, your sales process map may include additional stages or activities. The key is to create a visual representation that accurately reflects how your sales team operates and can be used as a tool for optimization and continuous improvement.
Have questions, insights, or experiences related to sales process mapping or continuous improvement?
We’d love to hear from you! Share your thoughts in the comments below.


