

Statistical tolerancing is a method that helps engineers manage how parts fit together by using math and probability. Think about your favorite smartphone or the engine in your car. These machines have hundreds of tiny parts. If every part were exactly the same size, assembly would be easy. But in the real world, no two parts are perfectly identical.
Have you ever wondered how companies make millions of products that work every single time? To be honest, they don’t aim for “perfect” parts. Instead, they use statistical tolerancing to predict how small variations in size will affect the final product. By looking at the big picture rather than just individual limits, factories can save money and improve quality.
In my experience, moving from old-school methods to this math-based approach is a game-changer for any design team. It’s not just about being “close enough.” It’s about knowing exactly how much wiggle room you have. Let’s look at why this matters for you and your business.
Table of contents
Why Statistical Tolerancing Matters for Your Design?
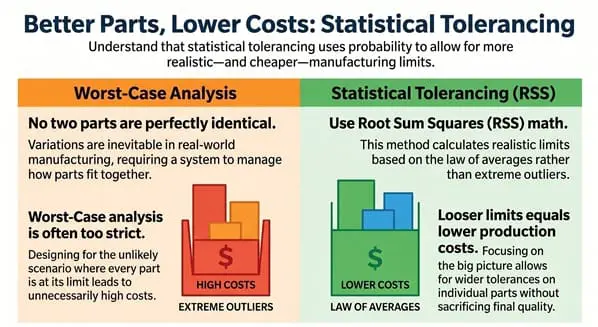
When we talk about statistical tolerancing, we are really talking about the law of averages. In the past, engineers used “Worst-Case” analysis. This meant they assumed every single part would be at its absolute biggest or smallest size at the same time. While this keeps things safe, it’s often too strict.
Does it make sense to design for a scenario that almost never happens? Probably not. Statistical tolerancing (ST) assumes that most parts will fall near the middle of the allowed range. By using the Root Sum Squares (RSS) method, we can calculate a more realistic assembly limit. This allows for looser limits on individual parts, which makes them cheaper to make.
The Core Math Behind Statistical Tolerancing
To understand statistical tolerancing, you have to understand the bell curve, or “Normal Distribution.” Most manufacturing processes naturally follow this pattern. Most parts are “average,” and very few are “extremes.”
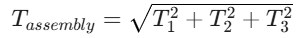
When you stack three parts together, the chance of all three being “too big” is very low. We use the RSS formula to find the total variation. You take the tolerances of each part, square them, add them up, and then take the square root.
This simple bit of math lets you widen the limits on your drawings. To be fair, it feels a bit like magic the first time you see it work. You get better yields and fewer rejected parts without hurting the final product’s performance.

Public, Onsite, Virtual, and Online Six Sigma Certification Training!
- We are accredited by the IASSC.
- Live Public Training at 52 Sites.
- Live Virtual Training.
- Onsite Training (at your organization).
- Interactive Online (self-paced) training,
Worst-Case vs. Statistical Tolerancing: Which is Better?
Here’s the thing: you don’t always need complex math. If you are making a bridge or a medical device where a single failure means disaster, Worst-Case (WC) is your friend. It guarantees 100% fit. But for most consumer goods, statistical tolerancing is the winner.
| Feature | Worst-Case Analysis | Statistical Tolerancing |
| Risk Level | Zero risk of fit issues | Small, calculated risk |
| Manufacturing Cost | Higher (Tight limits) | Lower (Relaxed limits) |
| Assembly Yield | 100% | 99.73% (at 3-sigma) |
| Complexity | Simple addition | Requires math/software |
We’ve all been there—staring at a drawing and wondering if we can loosen a limit to save $5 per part. If you’re making 100,000 units, that’s half a million dollars! Statistical tolerancing gives you the data to make that call with confidence.
Also Read: Degree of Freedom in Statistics
How to Implement Statistical Tolerancing in Your Workflow
Are you ready to try statistical tolerancing in your next project? Fast-forward to the production phase, and you’ll see why the setup is worth it.
First, you must ensure your process is “in control.” This means your machines produce consistent results over time. If your process is messy, the math won’t work. Second, pick your quality level. Most companies aim for “Six Sigma,” which means only 3.4 parts out of a million will fail.
Next, use software to run a “Monte Carlo” simulation. This is like a virtual assembly line. It “builds” thousands of products in seconds to see how often they fail. It’s a great way to catch problems before you ever cut a piece of metal.
Common Challenges with Statistical Limits
Is statistical tolerancing perfect? Not quite. One big trap is assuming every part follows a perfect bell curve. Sometimes a machine might “drift” or produce a skewed distribution. In these cases, a simple RSS calculation might give you the wrong answer.
That said, modern tools can handle these “non-normal” distributions. You just have to be aware of them. Another challenge is communication. You’ll need to explain to your suppliers that you are using ST. They need to understand that the “middle” of the range is more important than just staying inside the lines.
Also Read: Bayesian Statistics
Key Takeaways for Statistical Tolerancing
- Statistical tolerancing uses probability to set realistic part limits.
- It allows for wider tolerances than the Worst-Case method.
- The Root Sum Squares (RSS) formula is the primary tool for calculation.
- ST reduces manufacturing costs by increasing the “yield” of usable parts.
- It works best for high-volume production where 100% perfection isn’t required.
Frequently Asked Questions (FAQs) on Statistical Tolerancing
What is the difference between WC and ST?
Worst-Case (WC) adds up every maximum limit. ST assumes that extreme variations won’t happen all at once, using a square-root approach instead.
When should I avoid statistical tolerancing?
Avoid it for low-volume production (less than 100 parts) or for safety-critical components where even one failure is too many.
Does ST require special software?
While you can do basic RSS in Excel, complex assemblies usually need specialized CAD tools or Monte Carlo simulation software.
Is statistical tolerancing the same as Six Sigma?
They are related. Six Sigma is a goal for high quality, while statistical tolerancing is the engineering method used to reach that goal.
Final Words
In summary, statistical tolerancing is the bridge between theoretical design and real-world manufacturing. It acknowledges that “perfect” is the enemy of “profitable.” By using math to predict assembly fit, we can create better products at a lower cost.
At our core, we value precision and efficiency. We believe that every engineer should have the tools to balance quality with reality. Whether you are building the next great gadget or a massive industrial machine, understanding these statistical principles is your ticket to success. We’re here to help you navigate these choices and ensure your designs are ready for the factory floor.
About Six Sigma Development Solutions, Inc.
Six Sigma Development Solutions, Inc. offers onsite, public, and virtual Lean Six Sigma certification training. We are an Accredited Training Organization by the IASSC (International Association of Six Sigma Certification). We offer Lean Six Sigma Green Belt, Black Belt, and Yellow Belt, as well as LEAN certifications.
Book a Call and Let us know how we can help meet your training needs.


